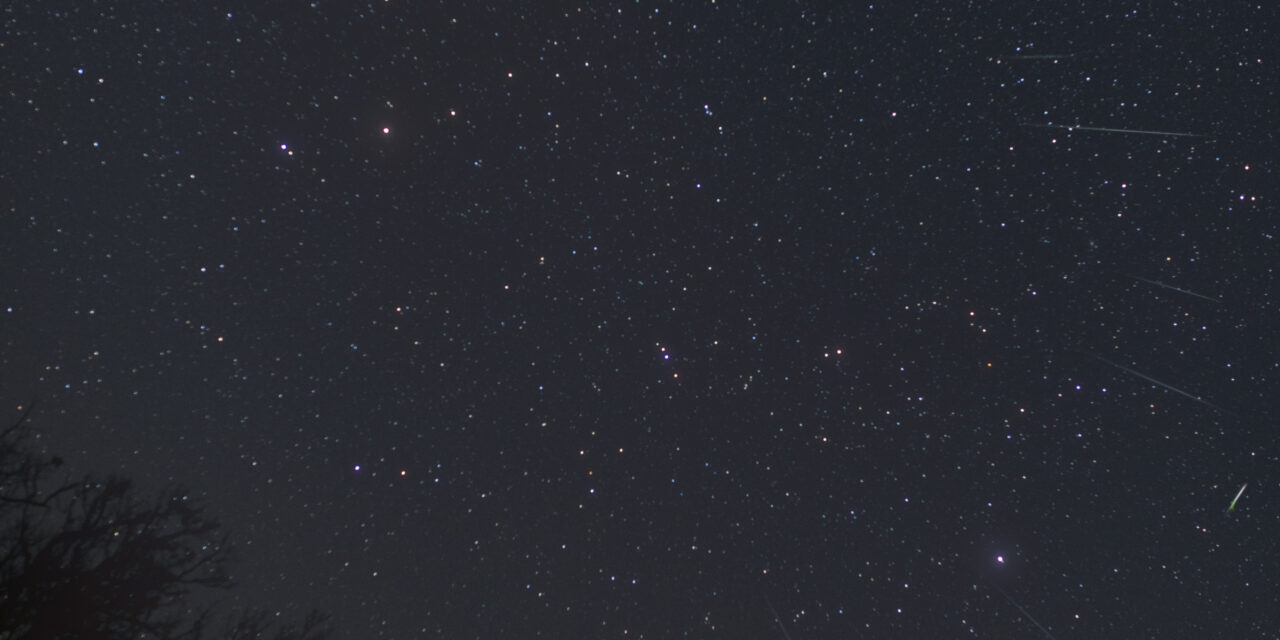
Figure 1. Composite image of 9 Ursids and 3 sporadic meteors captured on December 22/23 2009. Canon 6D, Sigma 35mm f/1.4 lens. © Pierre Martin
Update July 30, 2026. After the publication of this article, an additional set of observations became available in the IMO visual database. These observations were subsequently included in the analysis, resulting in two additional ZHR points and an improvement in the current ZHR points. Consequently, Figures 3, 4, 5, 6, and 9 have been adjusted.
Abstract
On the night of December 22, 2025 (UT), the Ursids exhibited a small outburst. Following reports from Pierre Martin and Jürgen Rendtel, it was decided to conduct an analysis to present on April 18 during the annual meeting of the Dutch Meteor Society. This article reiterates the results and provides additional info.
Characteristics
The Ursids are a small meteor shower active during the period from December 7 to January 7 [Jenniskens 2025]. The meteors are slow (33 km/s) and are mostly faint (population index r=2.8). The maximum ZHR during a normal Ursid year is usually around 10. The radiant of the Ursids is near RA 217 and Declination +76, which is near the star Kochab (beta Ursa Minor). The Ursids are known to exhibit regular outbursts. Interestingly, these occur both around the time the comet is at perihelion and at aphelion. The meteorshower originates from Comet 8P/Tuttle, which has an orbital period of 13.6 years. The comet was discovered on January 5, 1858, by Horace Parnell Tuttle. The Ursids became known after a major outburst on the evening of December 23, 1945 [Bečvář 1946], which was observed by observers at the Skalnaté Pleso Observatory. Another major outburst was also observed in 1986 [Jenniskens 1988]. More on this in a future second article.
Data collection
For the analysis of the 2025 observations, the “on the fly” ZHR curve of the 2025 Ursids was examined first: https://www.imo.net/members/imo_live_shower?shower=URS&year=2025
See also Figure 2.
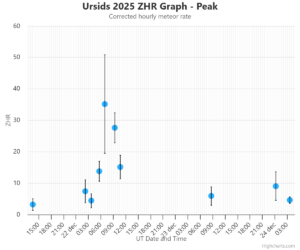
Figure 2. “On the fly” ZHR curve IMO website Ursids 2025
On the peak tab, it is clearly visible that a higher-than-normal ZHR was observed. One ZHR point reached ZHR 35. Checking that data point reveals that this ZHR determination was based on only 4 Ursids. Caution is always advised with the “on the fly” curve. It is a handy tool for quickly checking something, but one must always pay attention to the details. Moreover, the amount of data was very meager: only 13 observers provided data for 199 Ursids. The peak ZHR curve (Figure 2) is based on only 128 Ursids.
First of all, the data was downloaded. As always, it had to meet the well-known standard requirements:
- Only observers used who observed multiple Ursids
- Only observers with a reliable Cp value
- Minimum radiant height 25 degrees
- Minimum limiting magnitude 5.9
Population index r
Due to the small amount of data, it was decided to determine the population index r for only two periods. One during the maximum and one for the period before and after the maximum. From these, a population index r was calculated for the maximum r[-1:5]=2.50 ±0.27. For the period before and after the maximum, a population index r[-1:5]=3.00 ±0.23 was calculated [Steyaert 1981].
Zenital Hourly Rate (ZHR)
Based on the population index r calculated above, the ZHR was determined using the formula:
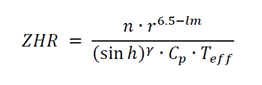
The result is Figure 3, which gives the ZHR of the Ursids for the period December 15 to 28, 2025. This calculation is based on the data as originally reported on the IMO website:
- Before and after December 22 based on hourly counts (0.75-1.00 hours)
- On December 22, counting periods between 0.3 and 1.0 hours
- ZHR calculated using weighted averages of individual ZHRs
- No correction for zenith attraction has been applied yet [Rendtel 2022]
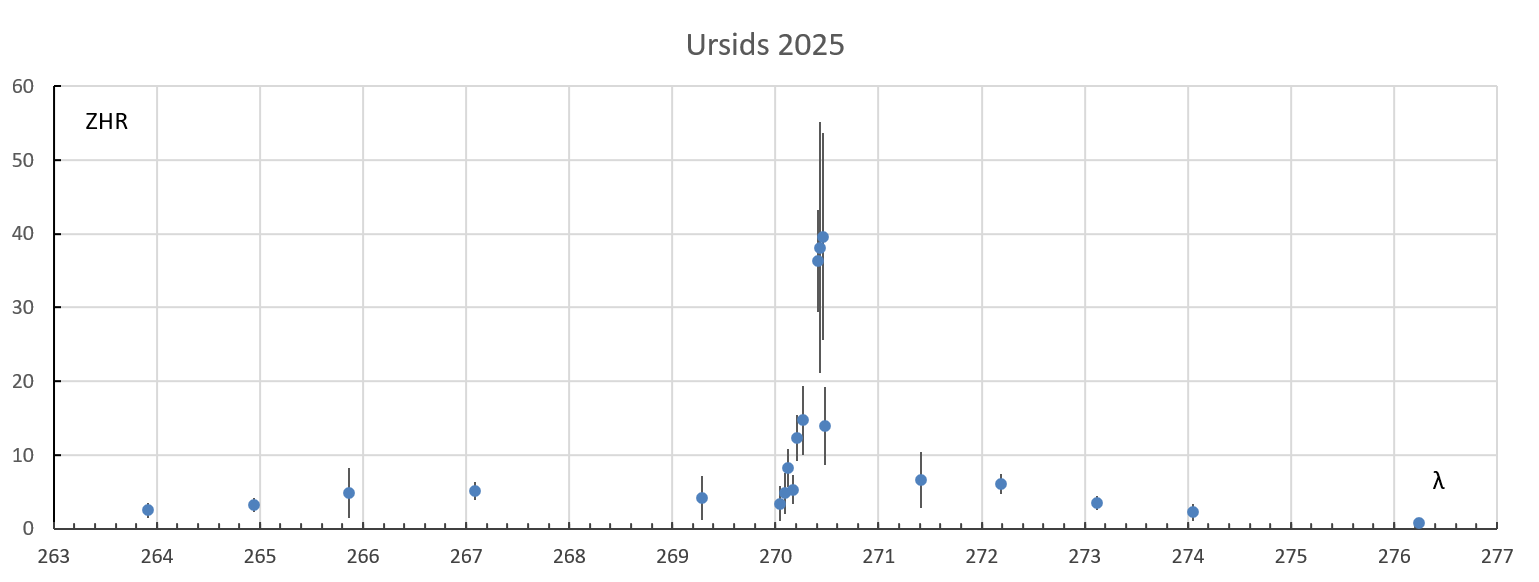
Figure 3. ZHR of the Ursids in 2025 between December 14-25, 2025. Based on 179 Ursids.
Zooming in on the maximum, see Figure 4.
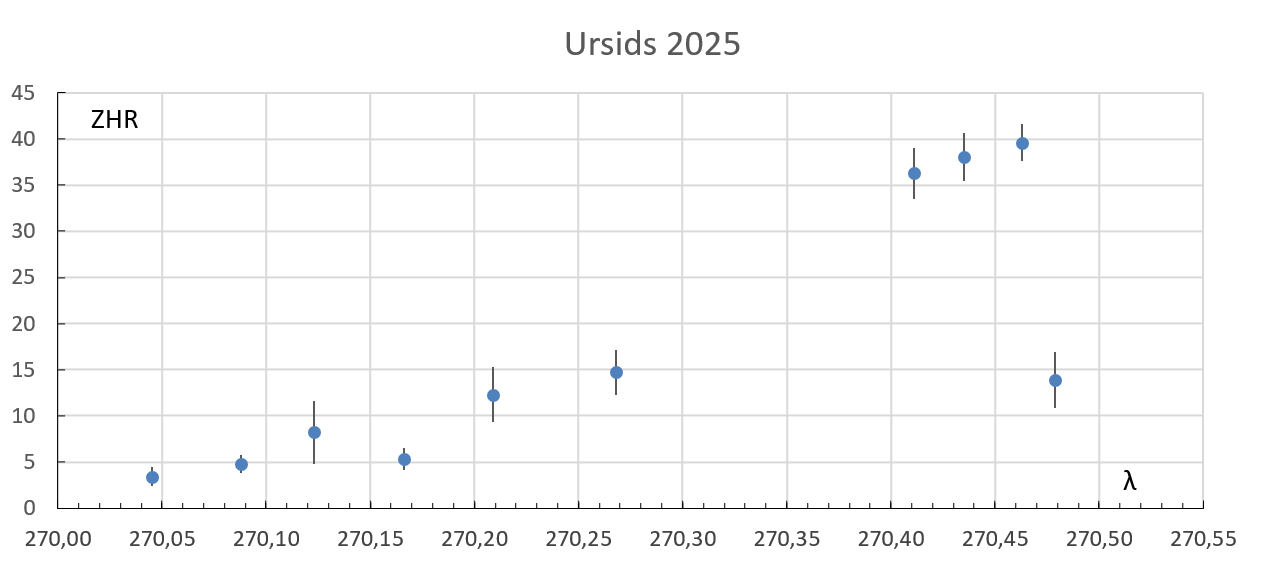
Figure 4. ZHR curve Ursids 21/22 December 2025. Based on 96 Ursids.
Figure 4 looks a bit strange. A slowly rising ZHR, and as soon as the maximum is reached, the ZHR collapses. The graph is based on data from only four observers who provided counting periods between 0.3 and 1.00 hours. These very diverse counting periods may well be the reason why the ZHR curve looks strange.
For this reason, the observers who observed the high activity (Terrence Ross and Pierre Martin) were asked to provide data in smaller periods. From the additional data they submitted, counting periods of 0.4 and 0.46 hours could be created. In addition, a correction for zenith attraction was applied for radiant positions below 40 degrees altitude. Subsequently, a ZHR determination was performed every 10 minutes with overlapping counting periods. The result of these calculations are Figures 5 and 6 and Table 1.
| Year | Month | Day | t/m | λꙨ | n Sessions | n URS | ZHR | ± |
| 2025 | 12 | 16 | 0,09 | 263,916 | 5 | 6 | 2,5 | 1,0 |
| 2025 | 12 | 17 | 0,38 | 264,946 | 7 | 11 | 3,2 | 1,0 |
| 2025 | 12 | 17 | 22,00 | 265,862 | 1 | 2 | 4,8 | 3,4 |
| 2025 | 12 | 19 | 2,92 | 267,089 | 7 | 19 | 5,1 | 1,2 |
| 2025 | 12 | 21 | 6,64 | 269,284 | 2 | 2 | 4,2 | 3,0 |
| 2025 | 12 | 22 | 0,58 | 270,045 | 1 | 2 | 3,4 | 2,4 |
| 2025 | 12 | 22 | 1,58 | 270,088 | 1 | 3 | 4,8 | 2,8 |
| 2025 | 12 | 22 | 2,42 | 270,123 | 2 | 10 | 8,2 | 2,6 |
| 2025 | 12 | 22 | 3,42 | 270,166 | 2 | 7 | 5,3 | 2,0 |
| 2025 | 12 | 22 | 4,48 | 270,209 | 3 | 16 | 12,3 | 3,1 |
| 2025 | 12 | 22 | 5,82 | 270,268 | 2 | 10 | 14,7 | 4,6 |
| 2025 | 12 | 22 | 8,88 | 270,398 | 2 | 16 | 52,1 | 13,0 |
| 2025 | 12 | 22 | 9,08 | 270,406 | 2 | 13 | 40,7 | 11,3 |
| 2025 | 12 | 22 | 9,22 | 270,412 | 2 | 11 | 30,1 | 9,1 |
| 2025 | 12 | 22 | 9,31 | 270,416 | 2 | 10 | 29,8 | 9,4 |
| 2025 | 12 | 22 | 9,43 | 270,421 | 2 | 11 | 32,2 | 9,7 |
| 2025 | 12 | 22 | 9,51 | 270,424 | 2 | 11 | 32,1 | 9,7 |
| 2025 | 12 | 22 | 9,62 | 270,429 | 2 | 11 | 37,1 | 11,2 |
| 2025 | 12 | 22 | 9,73 | 270,434 | 2 | 10 | 24,8 | 7,8 |
| 2025 | 12 | 22 | 9,88 | 270,440 | 2 | 8 | 17,8 | 6,3 |
| 2025 | 12 | 22 | 10,02 | 270,446 | 2 | 10 | 26,0 | 8,2 |
| 2025 | 12 | 22 | 10,15 | 270,451 | 2 | 10 | 25,8 | 8,2 |
| 2025 | 12 | 22 | 10,34 | 270,459 | 2 | 8 | 22,6 | 8,0 |
| 2025 | 12 | 22 | 10,59 | 270,470 | 2 | 5 | 14,7 | 6,6 |
| 2025 | 12 | 22 | 10,98 | 270,487 | 2 | 2 | 5,3 | 3,7 |
| 2025 | 12 | 23 | 8,65 | 271,407 | 2 | 3 | 6,6 | 3,8 |
| 2025 | 12 | 22 | 3,15 | 272,192 | 7 | 21 | 6,1 | 1,3 |
| 2025 | 12 | 25 | 1,02 | 273,120 | 8 | 15 | 3,5 | 0,9 |
| 2025 | 12 | 25 | 22,80 | 274,045 | 5 | 4 | 2,2 | 1,1 |
| 2025 | 12 | 28 | 2,47 | 276,239 | 9 | 5 | 0,8 | 0,4 |
Table 1. ZHR of the 2025 Ursids.
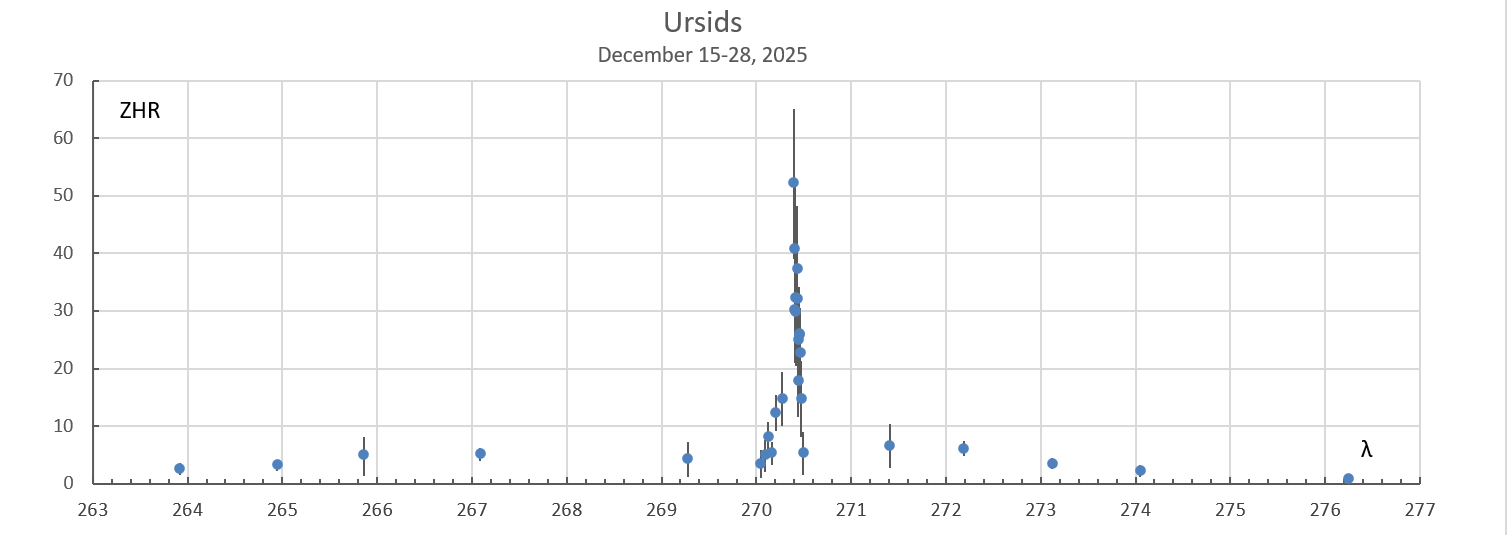
Figure 5. ZHR for the Ursids for the period 15-28 December 2025.
Few differences are visible over the entire 15-28 December period. However, the maximum in this calculation turns out 20% higher, with a ZHR of 52 compared to 40 in Figure 2. To zoom in on the maximum, see Figure 6.
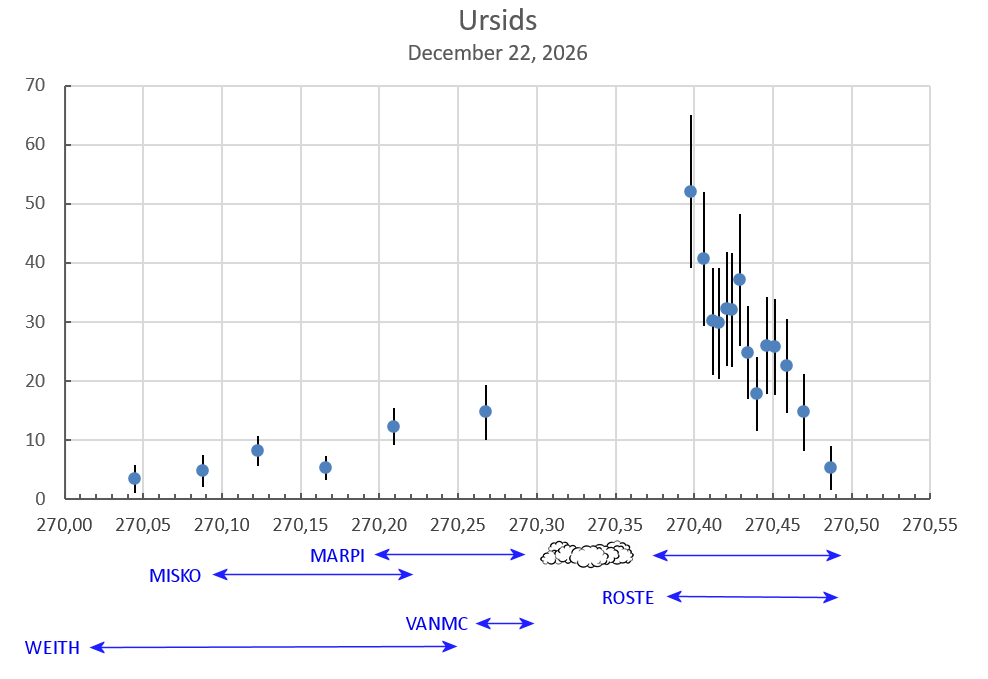
Figure 6. The Ursid maximum (December 21/22, 2025). The ZHR calculations are based on 1-hour counts for the period prior to λꙨ=270.30 and subsequently on 0.40 and 0.46-hour counts. Gamma is set to 1 and a population index r]-1;5] = 2.50 is used.
Due to the small amount of data used for this analysis, observations by whom and during which period are indicated below the graph. There we see that Pierre Martin experienced cloud cover for a longer period of time. This is unfortunate, as the built-up and perhaps also the peak were hidden behind this. Nevertheless, the ZHR curve looks much better than the first curve in Figure 4. The maximum ZHR is calculated immediately at the (re)start of the observations by Pierre Martin and Terrence Ross. A few sub-peaks also appear to be visible, but these are likely the result of the minimal amount of data on which Figure 5 is based. The maximum therefore occurred at λꙨ= 270.398 (22-12-2025 08:53 UT) or earlier.
The European part of the graph, which extends to solar longitude 270.30, is also interesting. Observer Thomas Weiland reports 7 Ursids between 270.109 and 270.152 with the following magnitude distribution: -2 (1x), -1 (1x), 0 (2x), +1 (2x) and +4 (1x). The ZHR curve also shows a small peak around that time. This “might” be the annual maximum; the maximum ZHR usually lies between 5 and 10. After solar longitude 270.20, the ZHR starts rising again to the much higher filament peak.
Comparison with radio (RMOB) and GMN video observations
Figures 7 and 8 show the results of the radio (RMOB)- and video (GMN) networks.
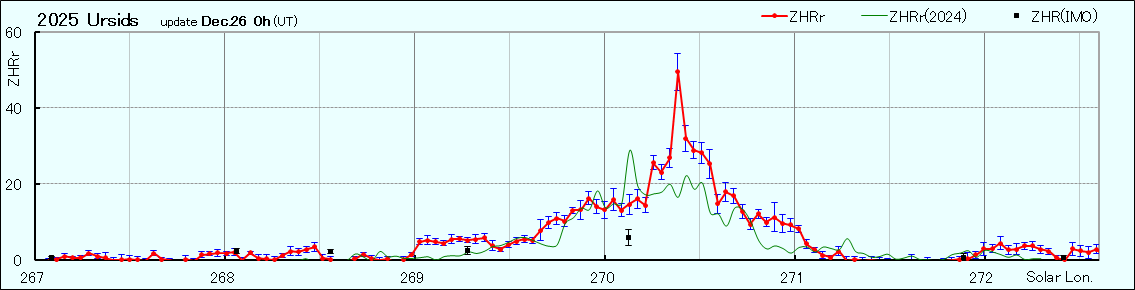
Figure 7. Radio ZHR r curve of the Ursids 2025 based on radio observation data collected by RMOB.
https://www5f.biglobe.ne.jp/~hro/Flash/2025/URS/index-e.htm
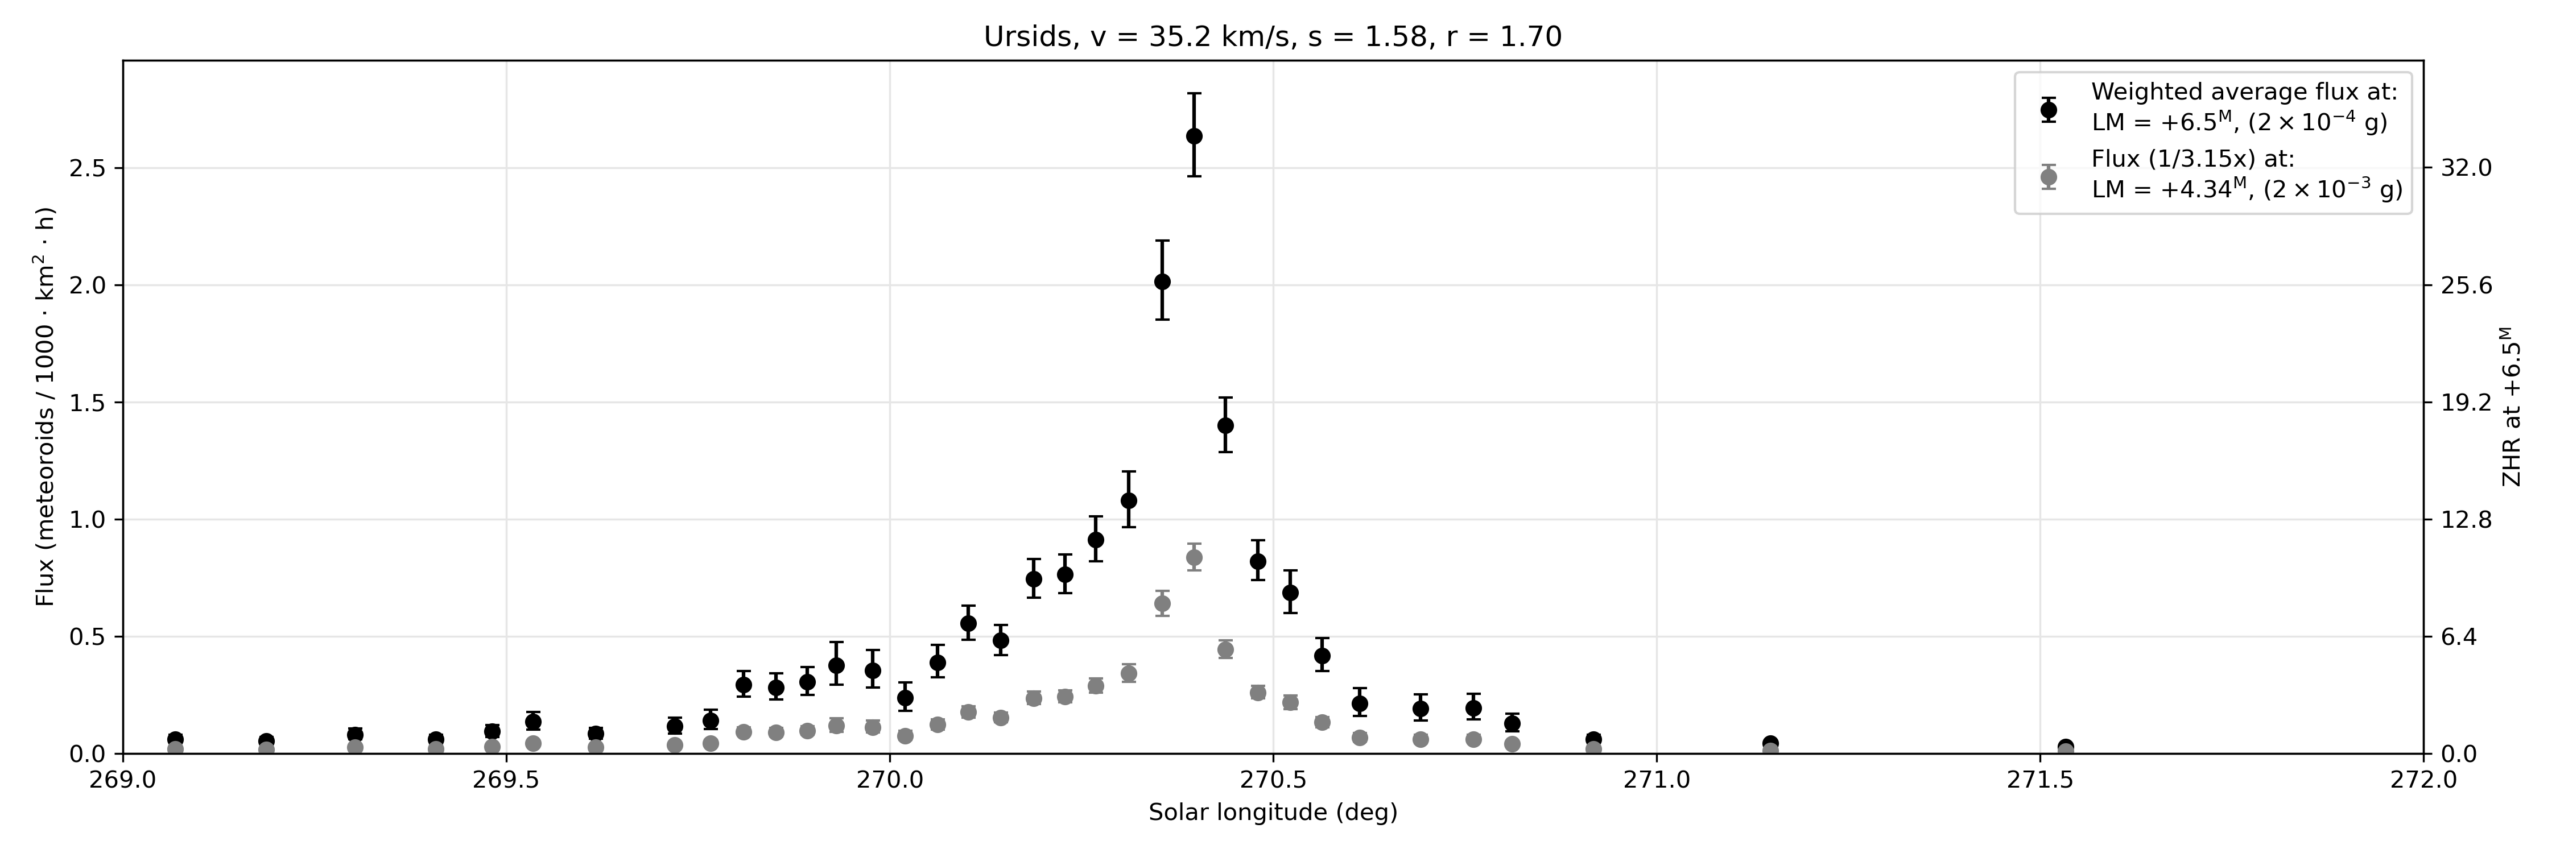
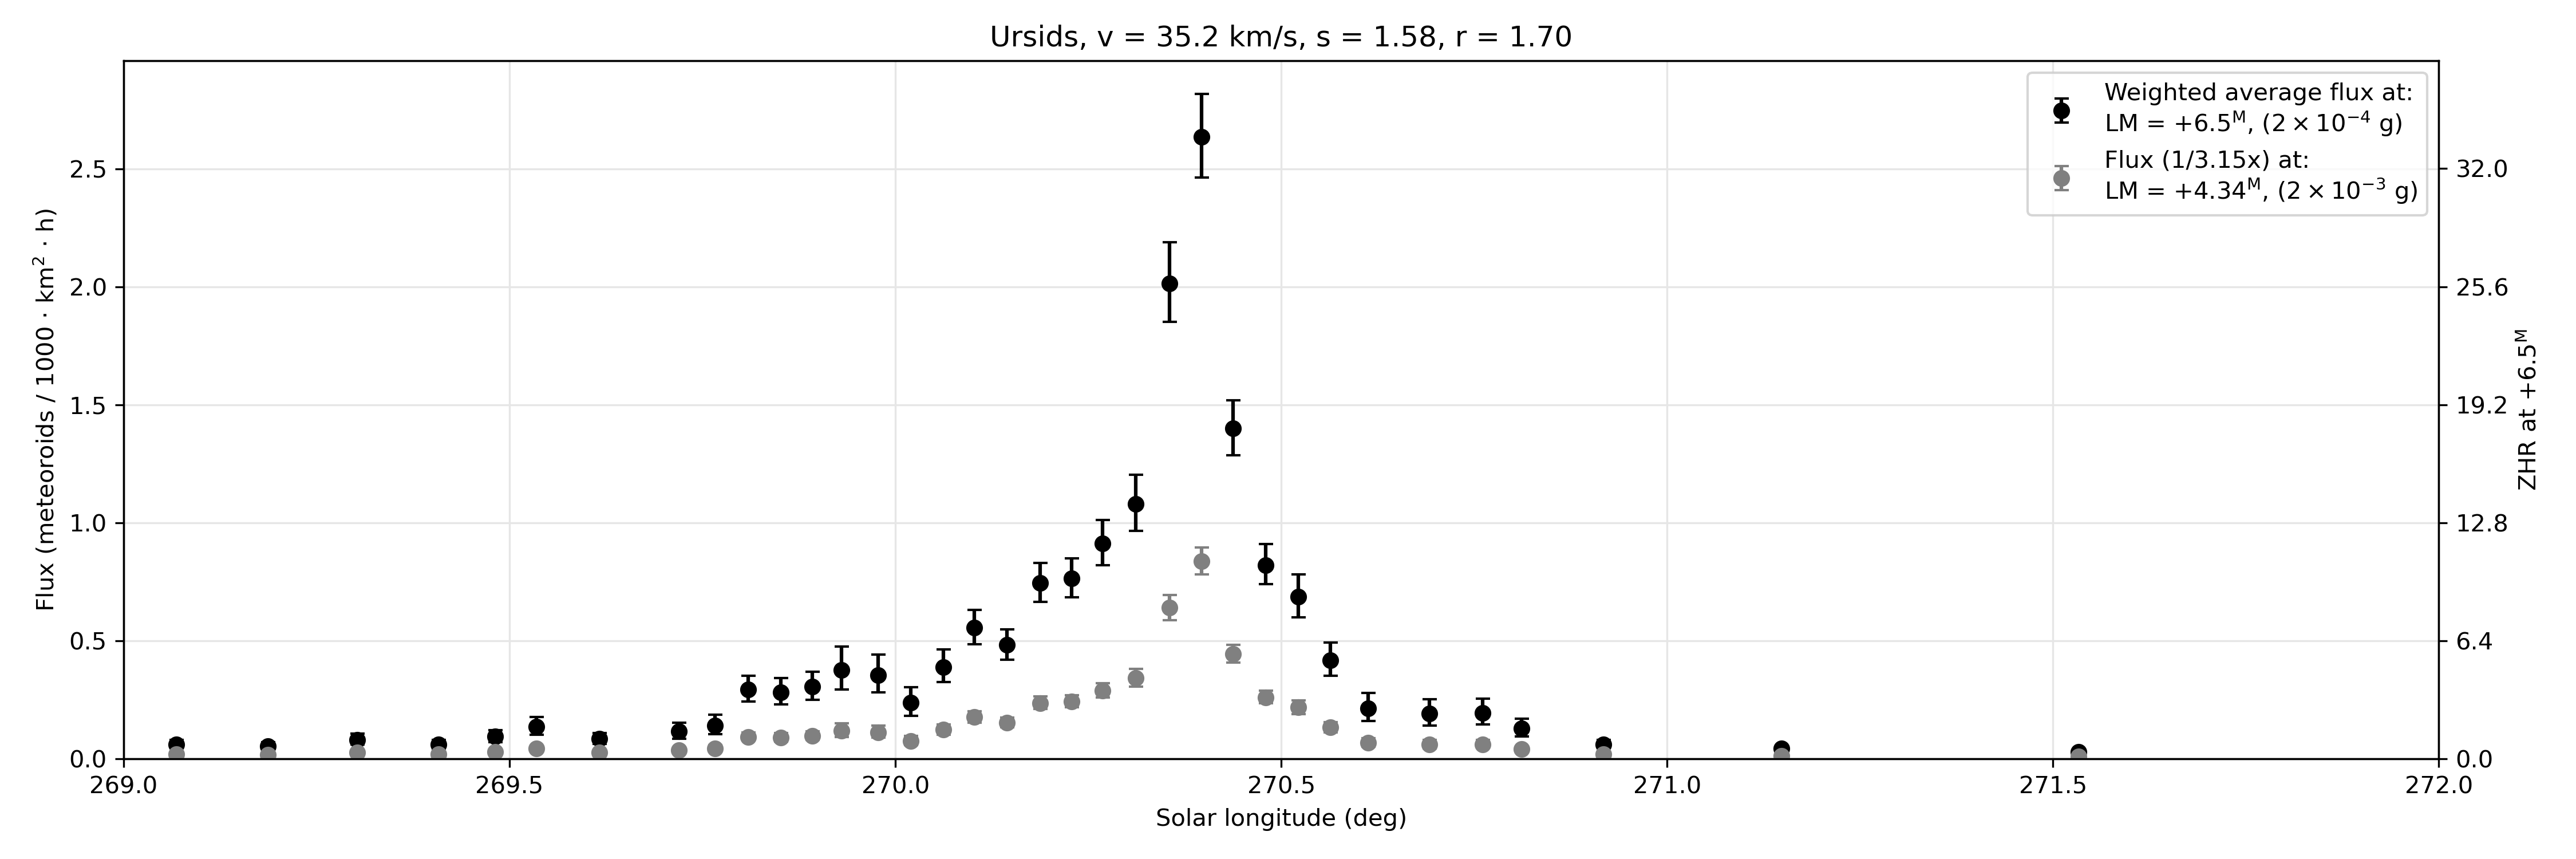
Figure 8. GMN ZHR curve of the Ursids based on simultaneous Urside observations.
https://globalmeteornetwork.org/flux/plots/flux_URS_sol%3D269.00-272.00_year_2025.png
It is clear that comparing with other observational methods is tricky. In this case, there was a nice agreement between the video and radio observations. Both find a maximum at the same time:
- Maximum visual : λꙨ=270,398° (22-12-2025 08:53 UT) or earlier. Population index r[-1;5]= 2,5.
- Maximum RMOB : λꙨ=270,382° (22-12-2025 08:26 UT)
- Maximum GMN : λꙨ=270,38° (22-12-2025 08:26 UT)
Thanks to Hirofumi Sugimoto and Hiroshi Ogawa [Sugimoto H. (2017) & Ogawa H. (2026) ], the author was able to make a ZHR graph with both visual ZHR and radio ZHRr data. The result is Figure 9 and shows a reasonably nice comparable progression despite the difference in observational methods.
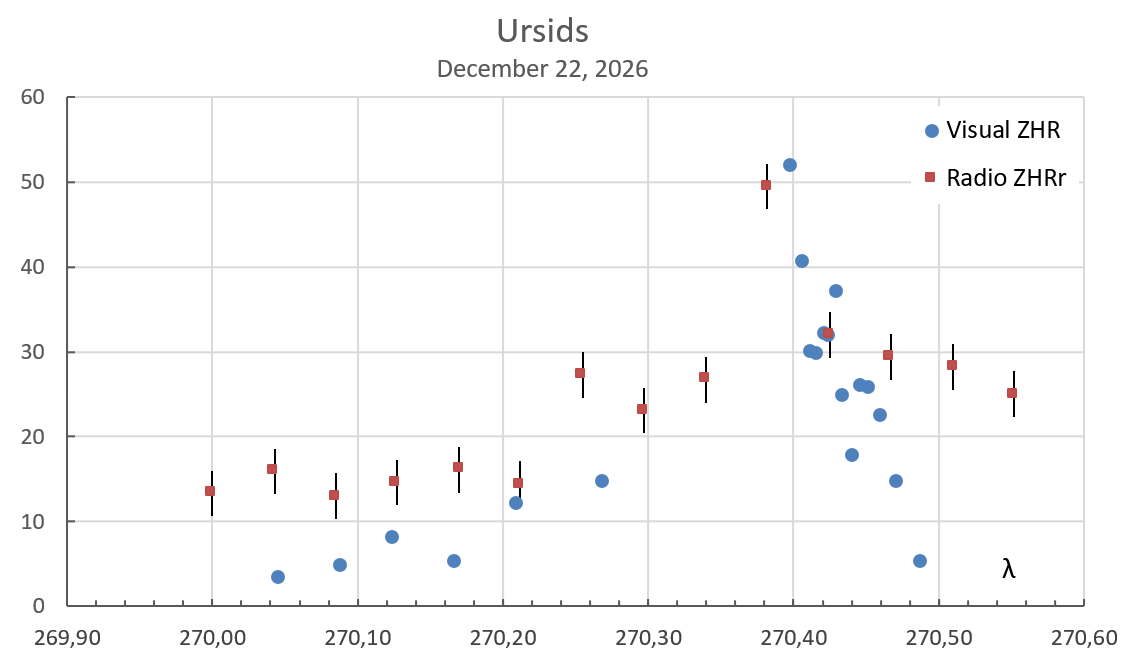
Figure 9. Radio ZHRr and visual ZHR of the Ursids during 21/22 december 2025.
What is the possible cause of this outburst?
Next, attempts were made to determine what caused the increased activity. In the book Meteor Showers and their Parent Comets [Jenniskens 2006], Peter Jenniskens gives the following for 2025: No dust trails were expected. These structures are very small, with a Width = 0.05° (± 1.2 hours) and a population index r 2.8. However, a filament was expected on 22-12-2025 at 05:39 UT with a population index r 2.6 and a ZHR of 25 on top of the annual activity. The expected Width of the filament is 0.35° (~8.4 hours). The same structure was also predicted for 2021, 2022, 2023 and 2024 but was not observed then. In the Meteor Shower Calendar 2025 [Rendtel 2024], Jeremy Vaubaillon expects the highest activity of the Ursids around 10 UT; no further information is provided.
The following was observed:
- The duration of the outburst assuming a ZHR exceeding 10: λꙨ=270.20 – 270.48° , W=0.28° (= ±6.7 hours).
- The duration of the outburst assuming a ZHR exceeding 5: λꙨ=270.10 – 270.48° , W=0.38° (=±8.0 hours).
- Maximum ZHR based on visual observations: 50 and possibly slightly higher because the maximum occurred somewhat earlier.
- Calculated population index r of the Ursid maximum is r[-1;5]=2.5
Conclusion
Visual observations shows that the Ursid filament was active on December 22, 2025, with a maximum at 8:25 UT (time based on RMOB and GMN observational data). Maximum ZHR 52 (or higher) which is 40% higher than expected in [Jenniskens 2006]. The duration of 6.7 – 8.0 hours and the observed bright meteors resulting in population index r[-1;5]=2.50 indicate that the filament was indeed observed here. Despite the small amount of visual data, a nice result was achieved here, and it aligns well with the radio and video observations. Thumbs up to the visual observers!
Acknowledgements
Many thanks to the observers who braved the December cold to observe the Ursids. These are: Mark Adams, Jean-Luc Biret, Steve Brown, Pete Kozich, Pierre Martin, Koen Miskotte, Ina Rendtel, Jürgen Rendtel, Terrence Ross, Stefan Schmeissner, Costantine Sigismondi, Michel Vandeputte, Thomas Weiland and Roland Winkler. Also a thank you to al radio [https://www.rmob.org] and video observers [https://globalmeteornetwork.org/] who contributed to the associated networks and results used in this analysis.
References
Bečvář A. (1946), IAU Circulair 1026.
Jenniskens P. (2006), Meteorshowers and Their Parent Comets, Cambridge Univercity Press 2006.
Jenniskens P. (2024), Atlas of Earth’s Meteor Showers, Elsevier Inc. 2024, p. 105-107.
Jenniskens P., Hillestad T.E. (1988), Meteor Section: Ursiden 1986, Radiant, 1988-2, p. 23 (Dutch).
Ogawa H. (2026) Ursids 2025 by worldwide radio meteor observations, eMetN 2026-2, p. 161-163
Rendtel J. (2024), 2025 Meteor Shower Calendar, IMO.
Rendtel J. et al (2022), Handbook for meteor observers, IMO.
Sugimoto H. (2017). “The New Method of Estimating ZHR using Radio Meteor observations”. eMetN Meteor Journal, 2, 109–110.
Steyeart C. (1981). “Populatie indexbepaling : methode en nauwkeurigheid”. Technische Nota nr. 5, VVS Werkgroep Meteoren, september 1981.