Mariasole Maglione (Rete CARMELo e GAV, Gruppo Astrofili Vicentini)
Lorenzo Barbieri (Rete CARMELo e AAB, Associazione Astrofili Bolognesi)
Gaetano Brando (Rete CARMELo e AAB, Associazione Astrofili Bolognesi)
Silvana Sarto (Rete CARMELo e AAB, Associazione Astrofili Bolognesi)
Giovanni Furlato (Rete CARMELo e MarSEC)
William Rivato (Rete CARMELo e MarSEC)
Introduction
Like February, March is also a quiet month for meteor showers, and, as expected, it did not feature any particularly notable showers. For this reason, we took the opportunity to delve deeper into the topic of meteor velocities in relation to the Earth’s position during its rotation.
Methods
The CARMELO network consists of SDR radio receivers. In them, a microprocessor (Raspberry) performs three functions simultaneously:
- By driving a dongle, it tunes the frequency on which the transmitter transmits and tunes like a radio, samples the radio signal and through the FFT (Fast Fourier Transform) measures frequency and received power.
- By analyzing the received data for each packet, it detects meteoric echoes and discards false positives and interference.
- It compiles a file containing the event log and sends it to a server.
The data are all generated by the same standard, and are therefore homogeneous and comparable. A single receiver can be assembled with a few devices whose total current cost is about 210 euros.
To participate in the network read the instructions on this page.
March data
In the plots that follow, all available at this page, the abscissae represent time, which is expressed in UT (Universal Time) or in solar longitude (Solar Long), and the ordinates represent the hourly rate, calculated as the total number of events recorded by the network in an hour divided by the number of operating receivers. The time resolution is 15 minutes.
In fig.1, the trend of signals detected by the receivers for the month of March.
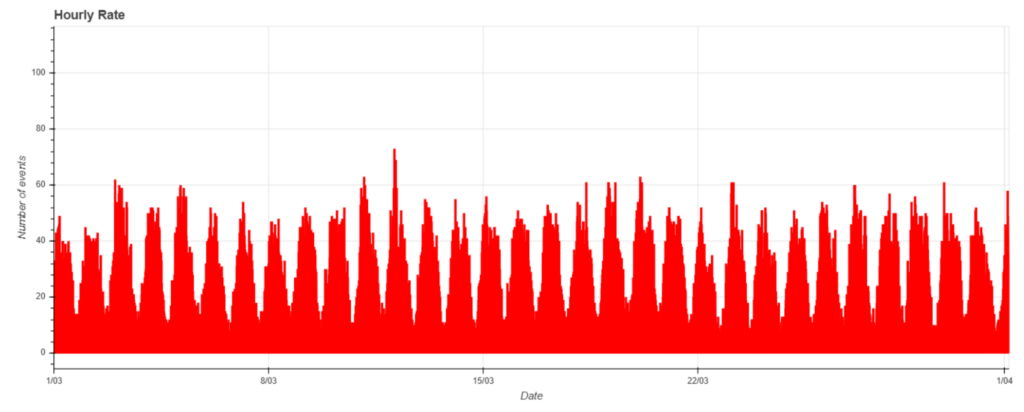
Fig. 1: March 2026 data trend.
Analysis of radio echo profiles and meteor velocities
In the previous report (2), we analyzed the variation in the average velocity of meteors throughout the day using statistics on radio power recorded by the CARMELo network. In that analysis, we observed how the graph of the average echo power – which is partly determined by the kinetic energy of the meteoroids – shows an opposite trend (out-of-phase) compared to the graph of the number of events, providing an indication of how speeds vary as a function of local time.
This month, we’re approaching the same topic from a different angle, no longer using a measurement such as power, but instead analyzing the profile of radio echoes – specifically, the signal’s rise time.
As is well known, the radar echo of a meteor is produced by the ionization of the atmosphere along the meteoroid’s trajectory. The passage of the particle generates a plasma cylinder consisting of free ion-electron pairs. The reflection of the radio signal off this ionized cylinder occurs according to the laws of specular reflection of electromagnetic waves: the angle of incidence equals the angle of reflection.
A fundamental consequence of this geometry is that the observed echo originates essentially from a single point along the meteoroid’s trajectory, known as the “point of specular reflection” or “point of closest approach” P. This is the point at which the total path of the signal (from the transmitter to the ionized cylinder and from there to the receiver) is as short as possible.
As a first approximation, therefore, the entire observational phenomenon can be described by considering only a region around this point.
Let us now consider a segment of the meteor’s trajectory centered at point P (see fig. 2). As we move away from P, the optical path length of the signal increases progressively, thereby increasing the signal delay and altering the phase of the received wave. The points at which this phase delay reaches λ/4 define the so-called “first Fresnel zone,” which represents the effective region of constructive interference of the reflected signal.
The characteristic length of this region, in the case of backscatter observations, is given by (1):
L=√2dλ
where:
- d is the distance between the transmitter and the meteor;
- λ is the wavelength of the transmitted and reflected radio signal.
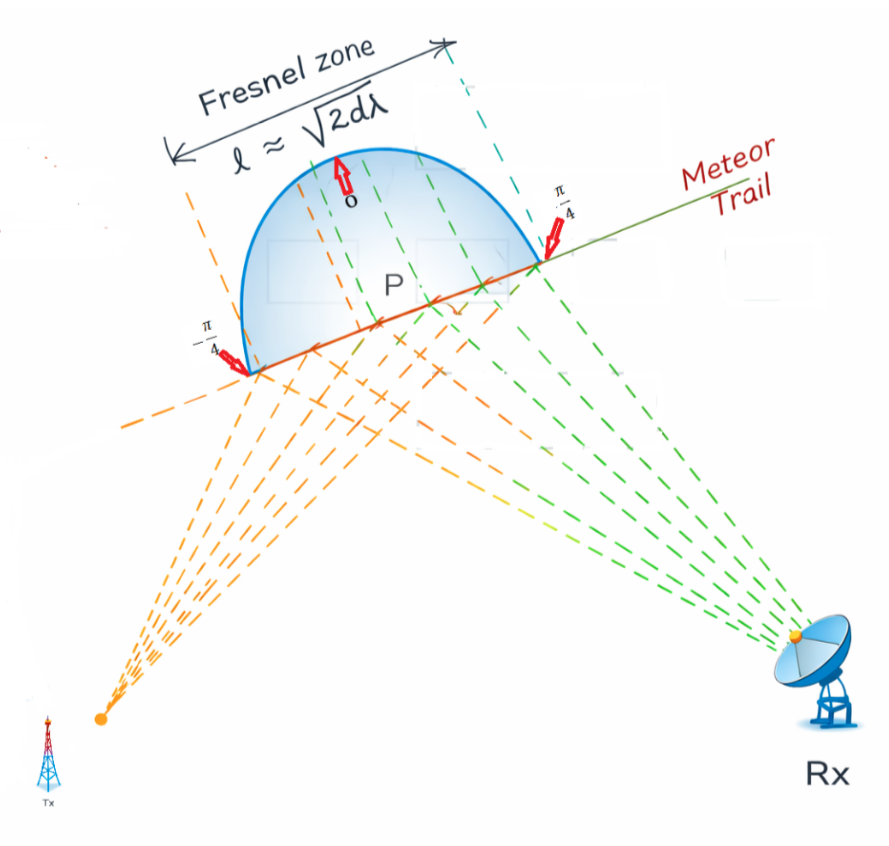
Fig. 2. Schematic representation of a Fresnel zone.
As the meteoroid passes through the first Fresnel zone, it progressively generates ionization, causing the signal to rise from zero to the maximum observed echo. The time taken for this passage is referred to as the rise time (the time it takes for the signal to rise).
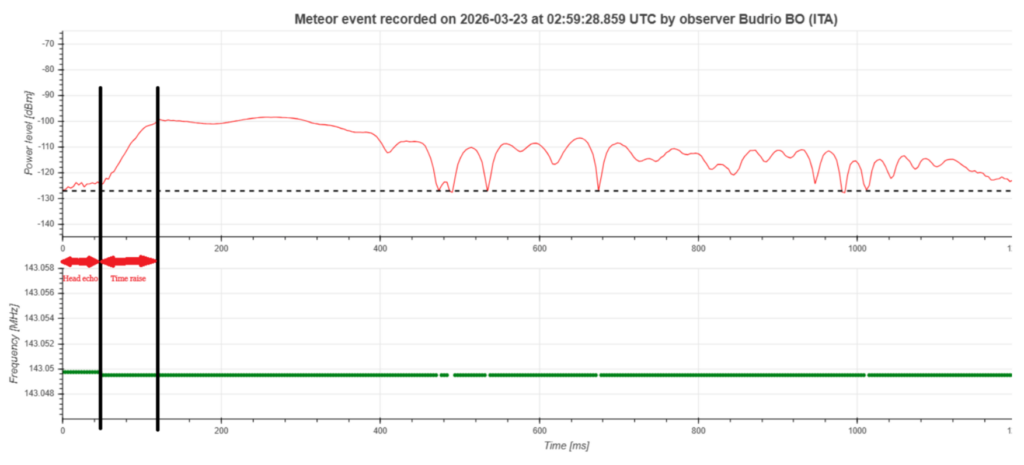
Fig. 3. Evaluation of the rise time on the signal profile of a radio meteor.
Assuming, as a first approximation, that the meteoroid moves in a uniform straight line, this time is related to the length L and the velocity v by an equation of the form (2):
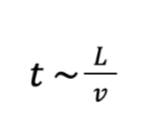
It follows that:
- Faster meteors have a shorter rise time;
- Slower meteors have a longer rise time.
In the previous bulletin (2), we explained how the speed at which meteors enter Earth’s atmosphere depends on the combination of their speed in interplanetary space and Earth’s orbital speed. In particular, meteors observed around 6 a.m. (local time) have velocities resulting from the sum of their speed in space (in the Solar System reference frame) and that of Earth, since the observer is facing the direction of Earth’s orbital motion. Conversely, around 6 p.m. (local time), meteors have velocities resulting from the difference between their own velocity and that of Earth, since the observer is looking in the direction opposite to Earth’s orbital motion.
Based on what we have just discussed, we therefore expect that:
- In the morning, the rise time will be shorter on average;
- In the evening, the rise time will be longer on average.
Of course, sporadic meteors arrive from random directions and at different intrinsic velocities. However, with a sufficiently large sample size, the statistical effects related to the geometry of Earth’s motion should become apparent.
To verify this prediction, we analyzed a database of events recorded by the CARMELo network over a period of more than one month, between January and February 2026.
To minimize the influence of meteor showers and focus on sporadic meteors:
- The first few days of January, dominated by the Quadrantids, were excluded;
- Only events with a signal-to-noise ratio greater than 20 dB were selected, in order to determine the echo’s temporal profile with greater precision;
- The data were divided into two groups:
- Events recorded during the two hours around 6 a.m. local time.
- Events recorded during the two hours around 6 p.m. local time.
A total of 405 meteors were observed in the morning and 262 in the evening. The rise time distributions obtained for the two time intervals are shown in fig. 4 and fig. 5.
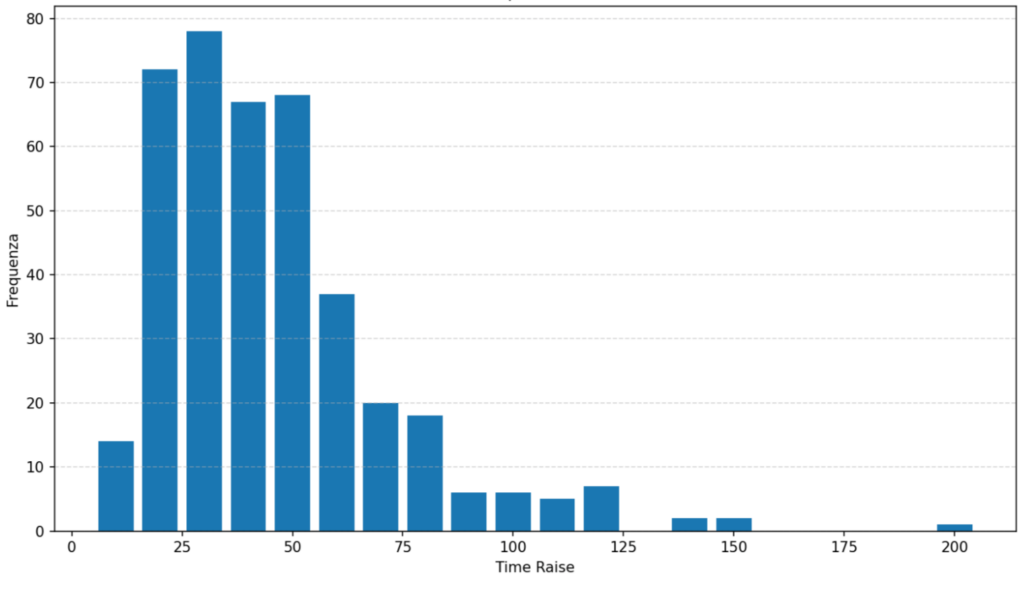
Fig. 4 Distribution of rise times around 6 a.m. local time.
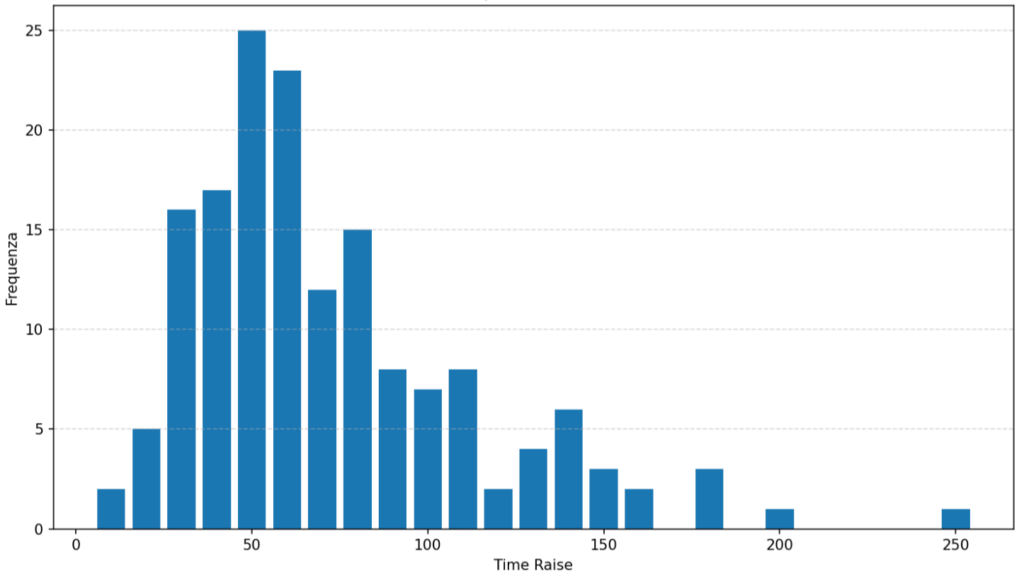
Fig. 5 Distribution of rise times around 6 p.m. local time.
The analysis clearly shows that:
- The morning distribution is skewed toward shorter rise times;
- The evening distribution shows a higher proportion of longer rise times.
This analysis confirms, using a completely independent approach, the results obtained in the previous bulletin:
- The average speed of the observed meteors varies throughout the day;
- This variation is a direct consequence of the geometry of the Earth’s motion.
We can also attempt to verify whether the order of magnitude of the rise time measured by CARMELo is consistent with the velocities of the meteors. To this end, we use (1) to estimate the dimensions of the first Fresnel zone. We consider the equation valid also for a forward-scatter system and apply it to the Graves–Italy geometry, taking into account the frequency of the Graves transmitter.
Let us therefore assume that d = 600 000 and λ = 2 (meters): from (1) we obtain a Fresnel zone length of approximately 1500 meters.
Applying (2) for a time rise of 30 ms – such as those predominant in the morning – we find a value slightly above 50,000 m/s, a value that is nearly halved for rise times of 50 ms, such as those predominant in the evening. These values are perfectly consistent with the order of magnitude of meteor velocities relative to Earth, which, as we know, range from 16 to 72 km/s.
This demonstrates that the CARMELo network does not merely count events, but is capable of deriving physical information about meteors by analyzing the shape of radio echoes in detail. The fact that a time-dependent parameter such as the rise time – which is directly linked to the meteoroid’s velocity – exhibits the theoretically predicted trend provides further observational confirmation of the dynamics of meteor impacts.
The CARMELo network
The network currently consists of 15 receivers located in Italy, the UK, Switzerland and the USA. The European receivers are tuned to the Graves radar station frequency in France, which is 143.050 MHz. Participating in the network are:
- Lorenzo Barbieri, Budrio (BO) ITA
- Associazione Astrofili Bolognesi, Bologna ITA
- Associazione Astrofili Bolognesi, Medelana (BO) ITA
- Paolo Fontana, Castenaso (BO) ITA
- Associazione Astrofili Pisani, Orciatico (PI) ITA
- Gruppo Astrofili Persicetani, San Giovanni in Persiceto (BO) ITA
- Roberto Nesci, Foligno (PG) ITA
- MarSEC, Marana di Crespadoro (VI) ITA
- Gruppo Astrofili Vicentini, Arcugnano (VI) ITA
- Associazione Ravennate Astrofili Rheyta, Ravenna (RA) ITA
- Mike German a Hayfield, Derbyshire UK
- Mike Otte, Pearl City, Illinois USA
- Yuri Malagutti, Comano (TI) CH
- Leslie Fry, Trawscoed Ceredigion, Wales UK
- Brian Coleman, Redenham Observatory, Andover, England UK
The authors’ hope is that the network can expand both quantitatively and geographically, thus allowing the production of better quality data.
References
(1) Oleg I. Belkovich e Jean-Marc Wislez (2006): “The physics of backscattering of radio waves from ionized meteor trails”. Proceedings of radio meteor school 2005, p. 27-33
(2) M. Maglione, L. Barbieri (2026): “Bollettino delle radiometeore di febbraio 2026”