By Paul Roggemans, Denis Vida, Damir Šegon, James M. Scott, Jeff Wood
Abstract: An activity source with a large diffuse radiant at R.A. = 142° and Decl.= –52°, and a geocentric velocity of 42.0 km/s, identified as the kappa-Velids, was detected between the 19th of December 2025 and 2nd of January 2026. The shower has been detected since 2020 by the GMN. This case study confirms the existence of this annual meteor shower, meaning that it is now recognized by multiple independent methods and this fulfills the criteria required to be nominated for established status by the IAU-MDC.
1 Introduction
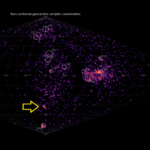
During the monitoring of the outburst of the Volantids in 2025–2026 (Roggemans et al., 2026a) a diffuse but nevertheless relative strong activity source was detected. The shower is identified as the kappa-Velids (KVE-784), and was visible as a very bright spot on the radiant density map for December 2025 (Figure 1). The kappa-Velids radiate from a very dispersed radiant, almost 20° in diameter, with a very changeable appearance during the activity period. Figure 2 shows these changes day-by-day in close-up.
The shower was first noticed by Pokorny at al. (2017) in meteor radar data collected in 2012–2015 by SAAMER (Southern Argentine Agile Meteor Radar). Jenniskens (2023) suggested that CAMS low light camera data show that the kappa-Velids consists of several showers.
Figure 1 – Radiant density map with 111113 radiants obtained by the Global Meteor Network during December, 2025. The position of the kappa-Velids in Sun-centered geocentric ecliptic coordinates is marked with a yellow arrow.
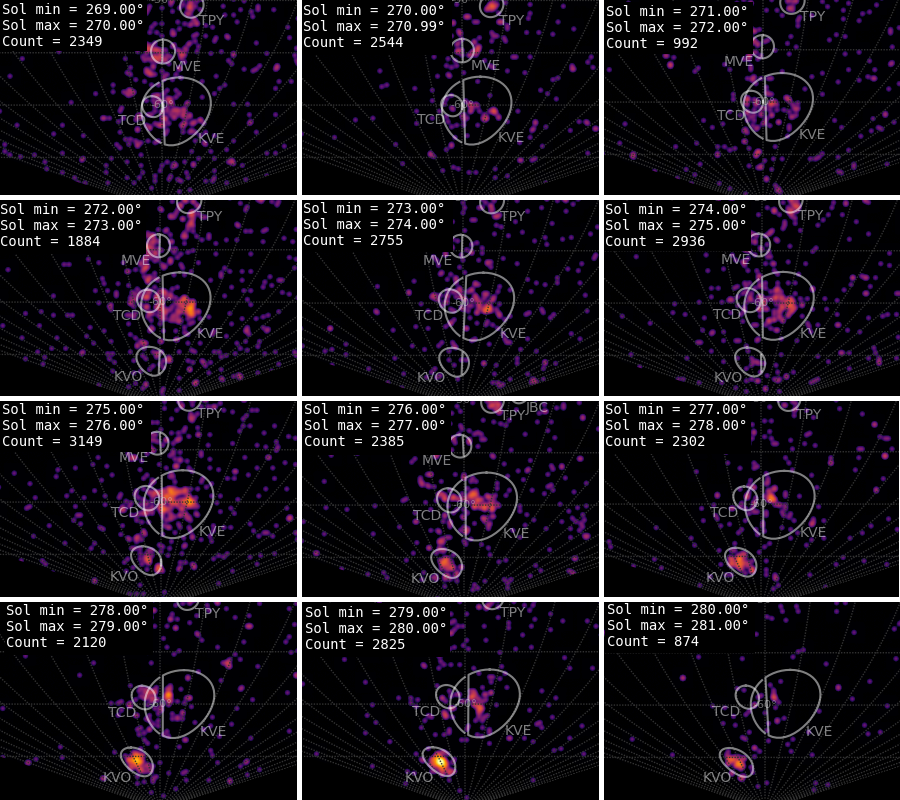
Figure 2 – Day by day changes in the appearance of the kappa-Velids radiant for the solar longitudes between 269° and 281°.
2 Shower classification based on radiants
The GMN shower association criteria assume that meteors within 1° in solar longitude, within 8.8° in radiant in this case, and within 10% in geocentric velocity of a shower reference location are members of that shower. Further details about the shower association are explained in Moorhead et al. (2020). Using these meteor shower selection criteria, 386 orbits have been identified as kappa-Velids recorded in 2025–2026 by 235 GMN cameras installed in Australia, Brazil, New Zealand, United States and South Africa. The final results have been listed in Table 1.
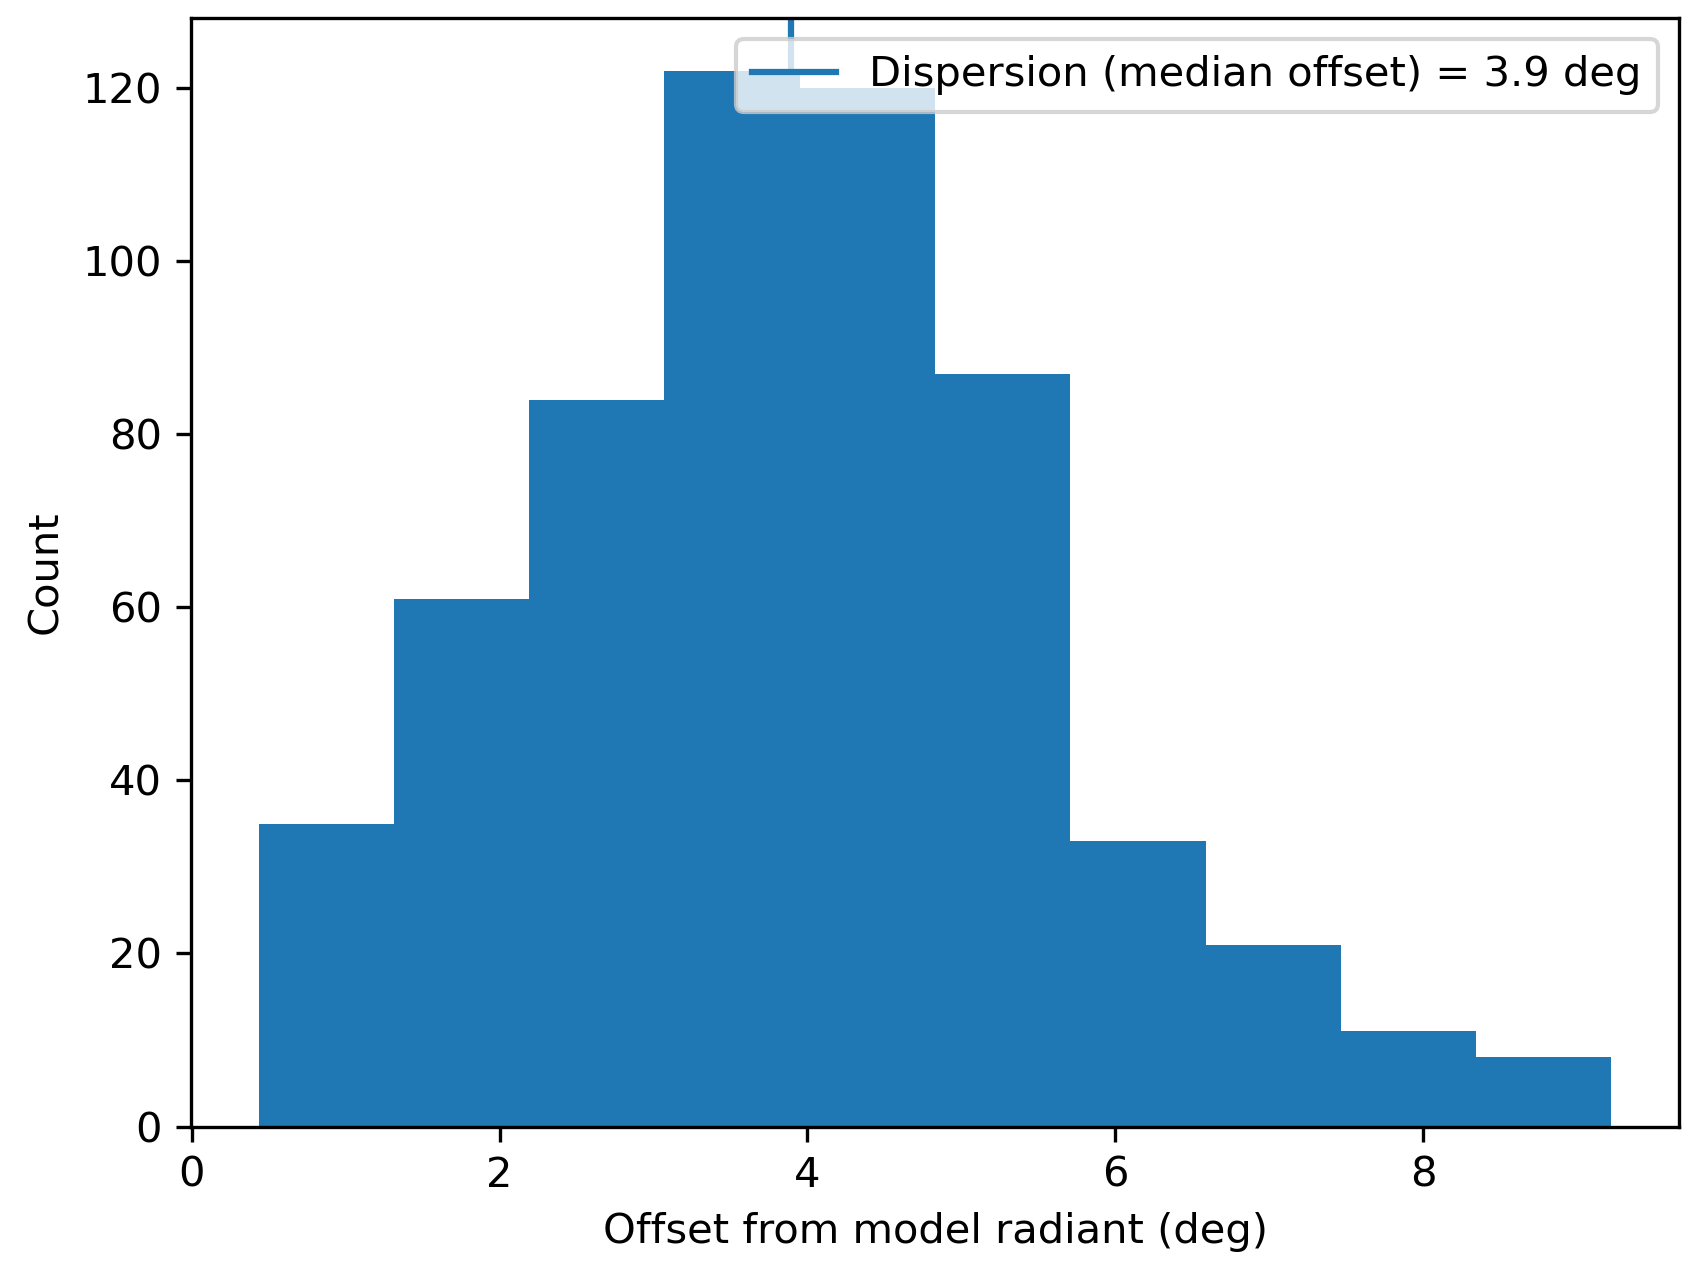
Figure 3 – Dispersion median offset on the radiant position.
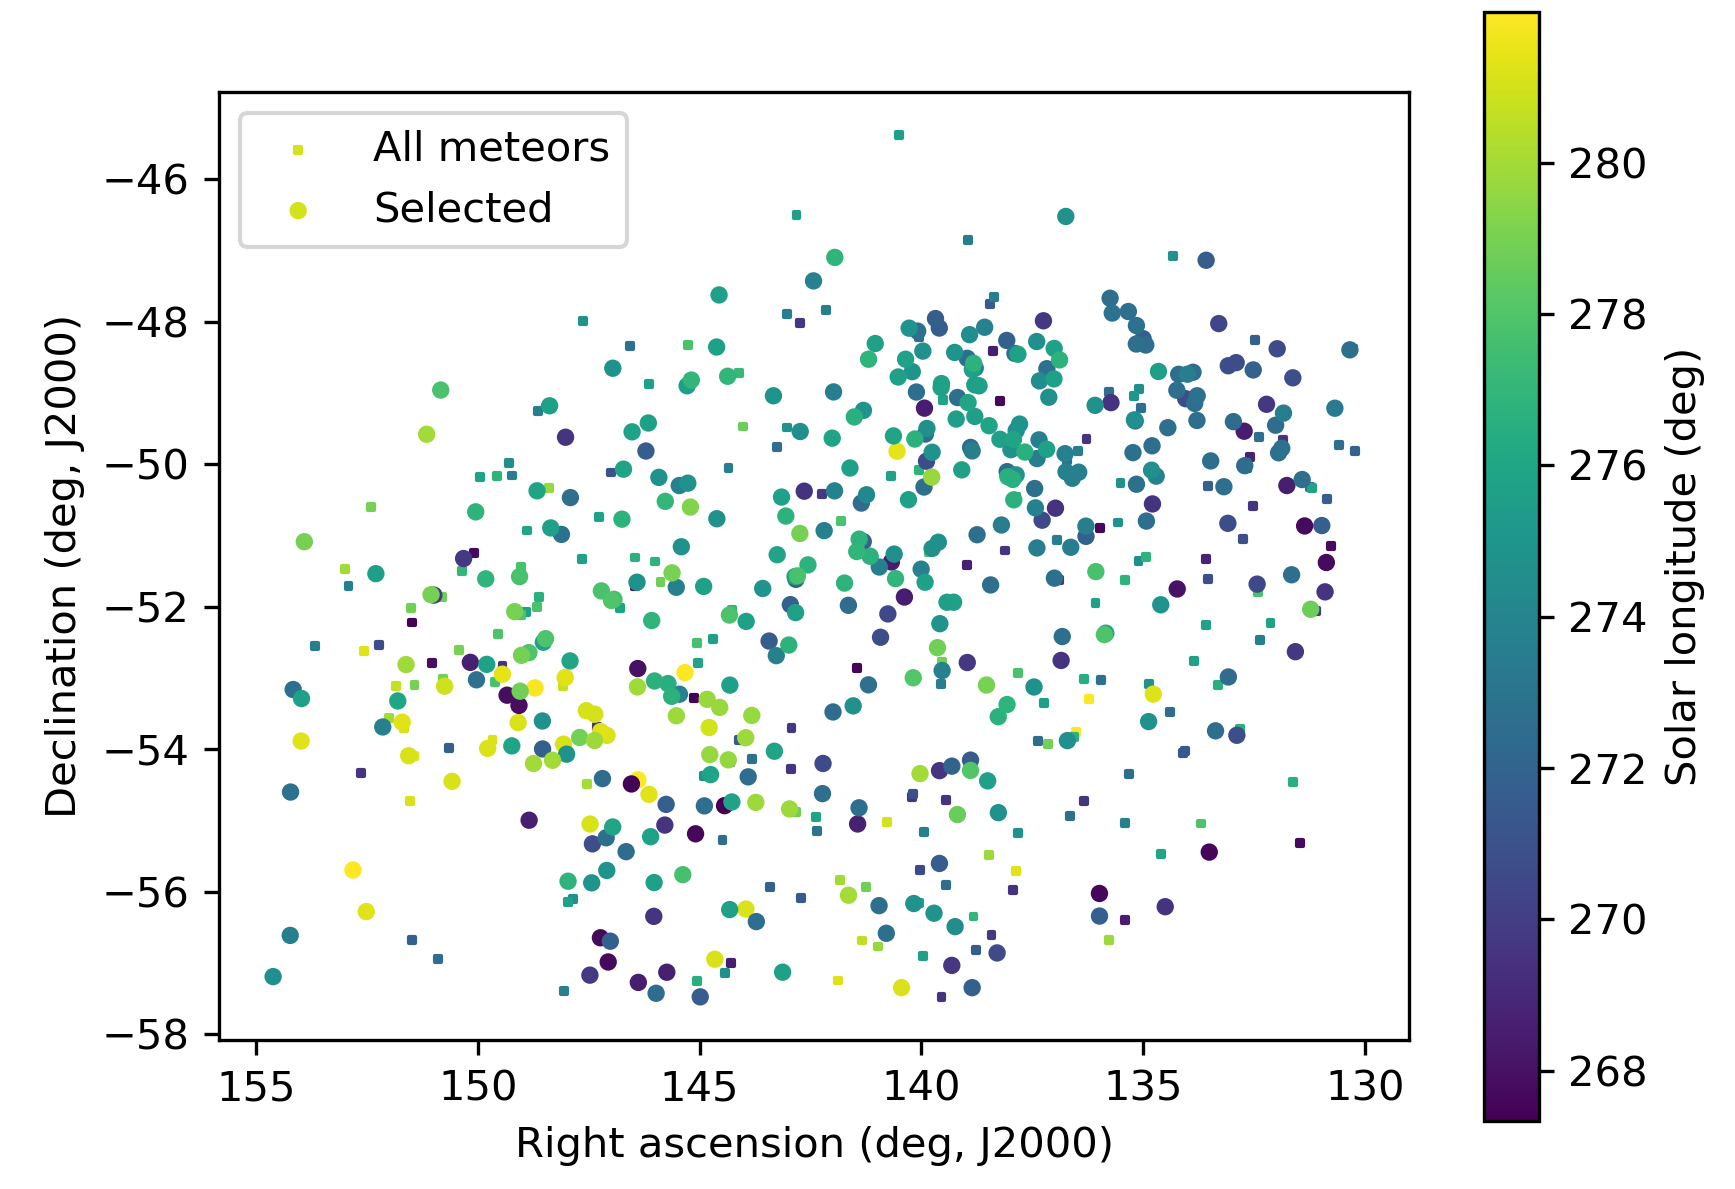
Figure 4 – The radiant distribution during the solar-longitude interval 267.5° – 281.5° in equatorial coordinates.
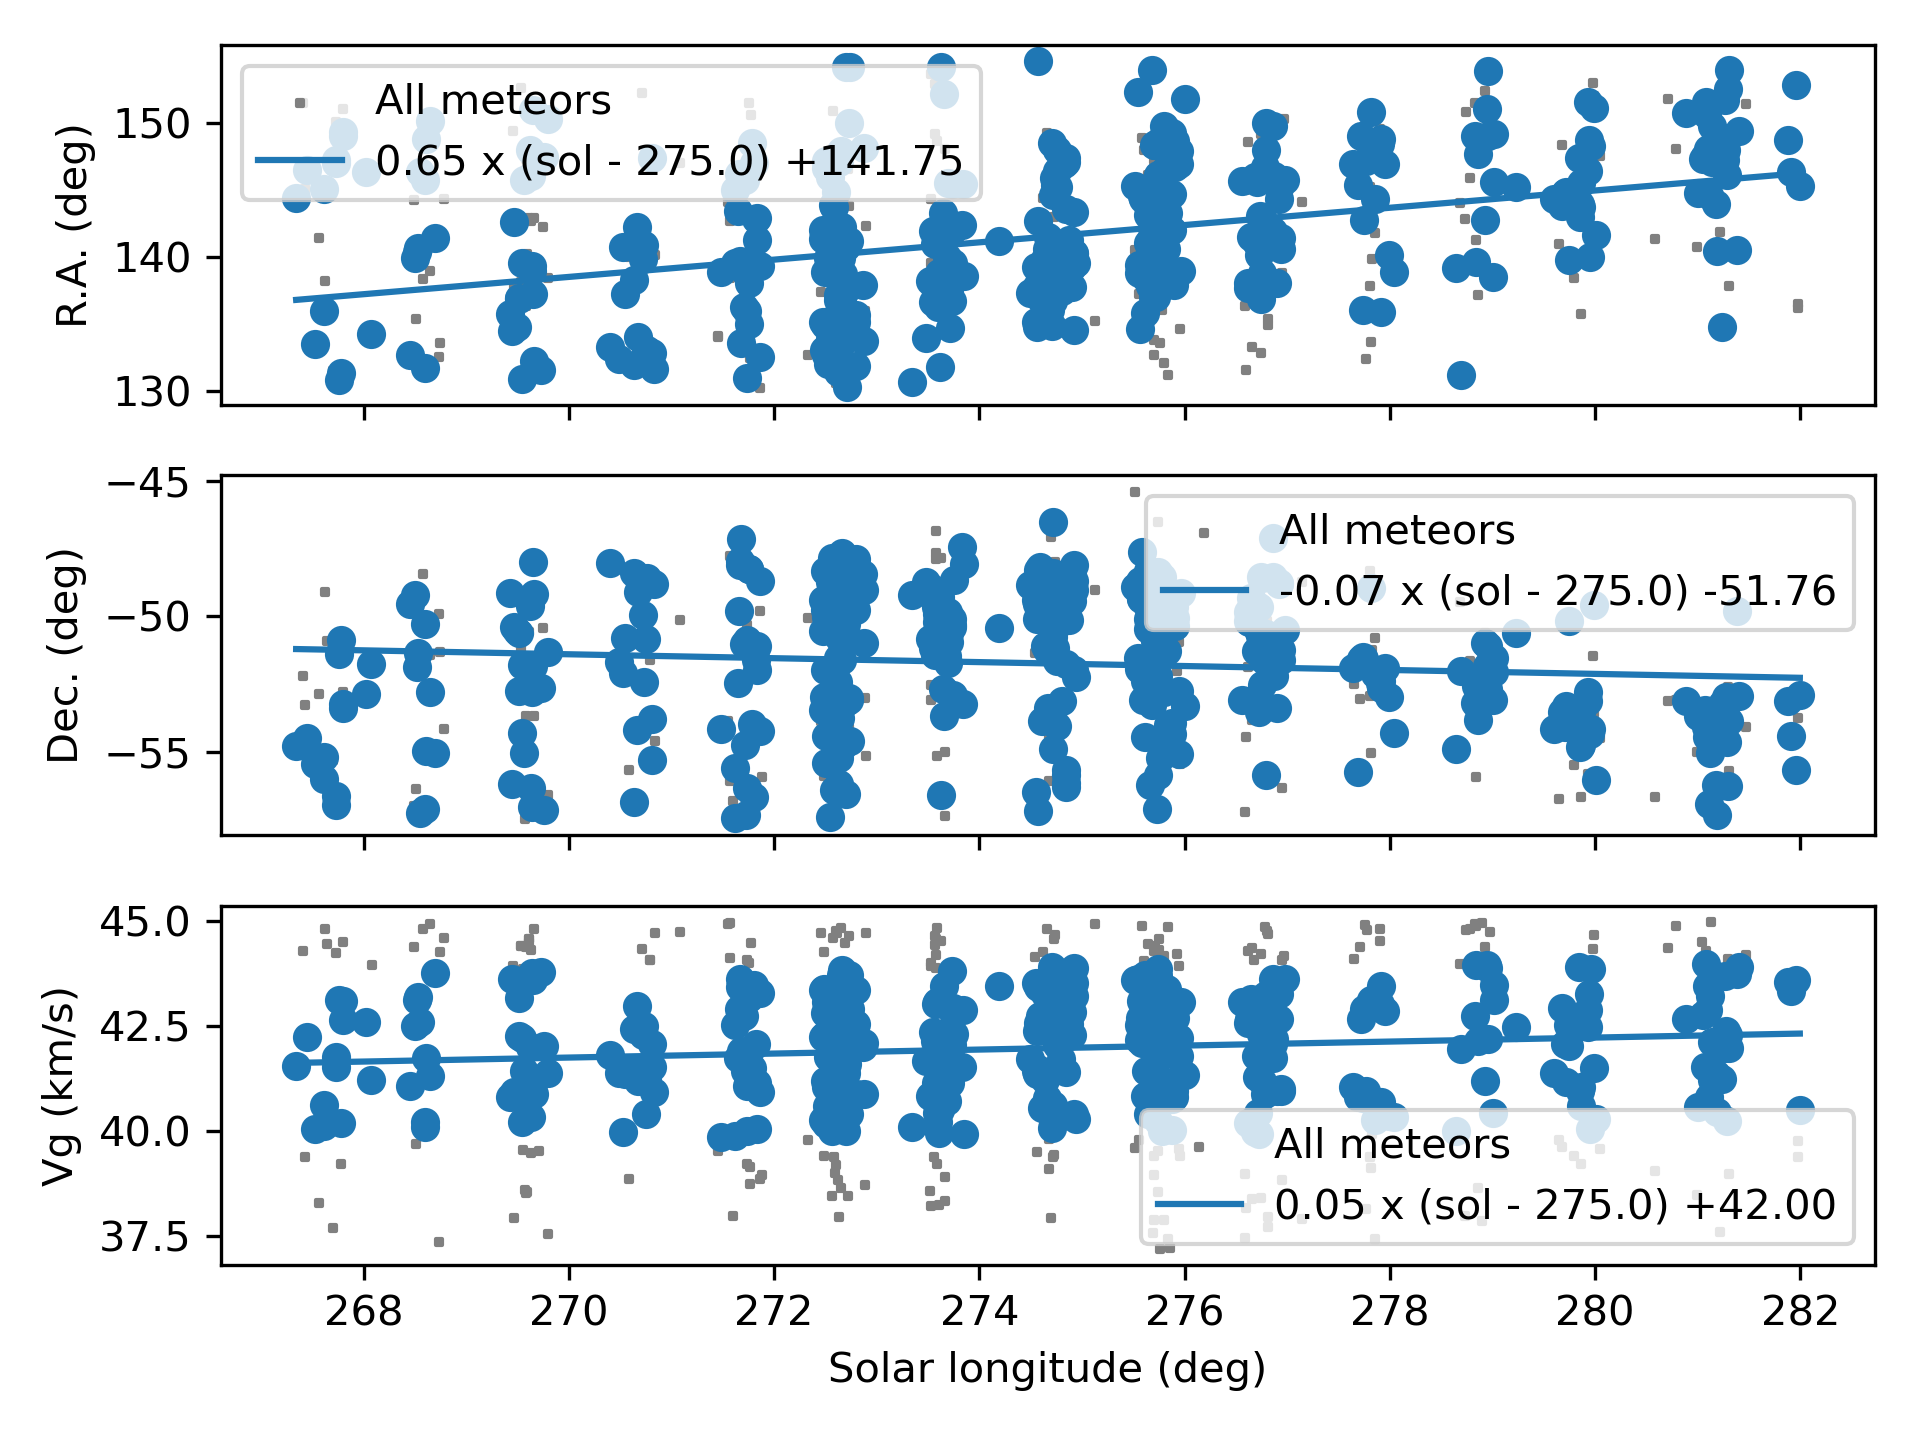
Figure 5 – The radiant drift.
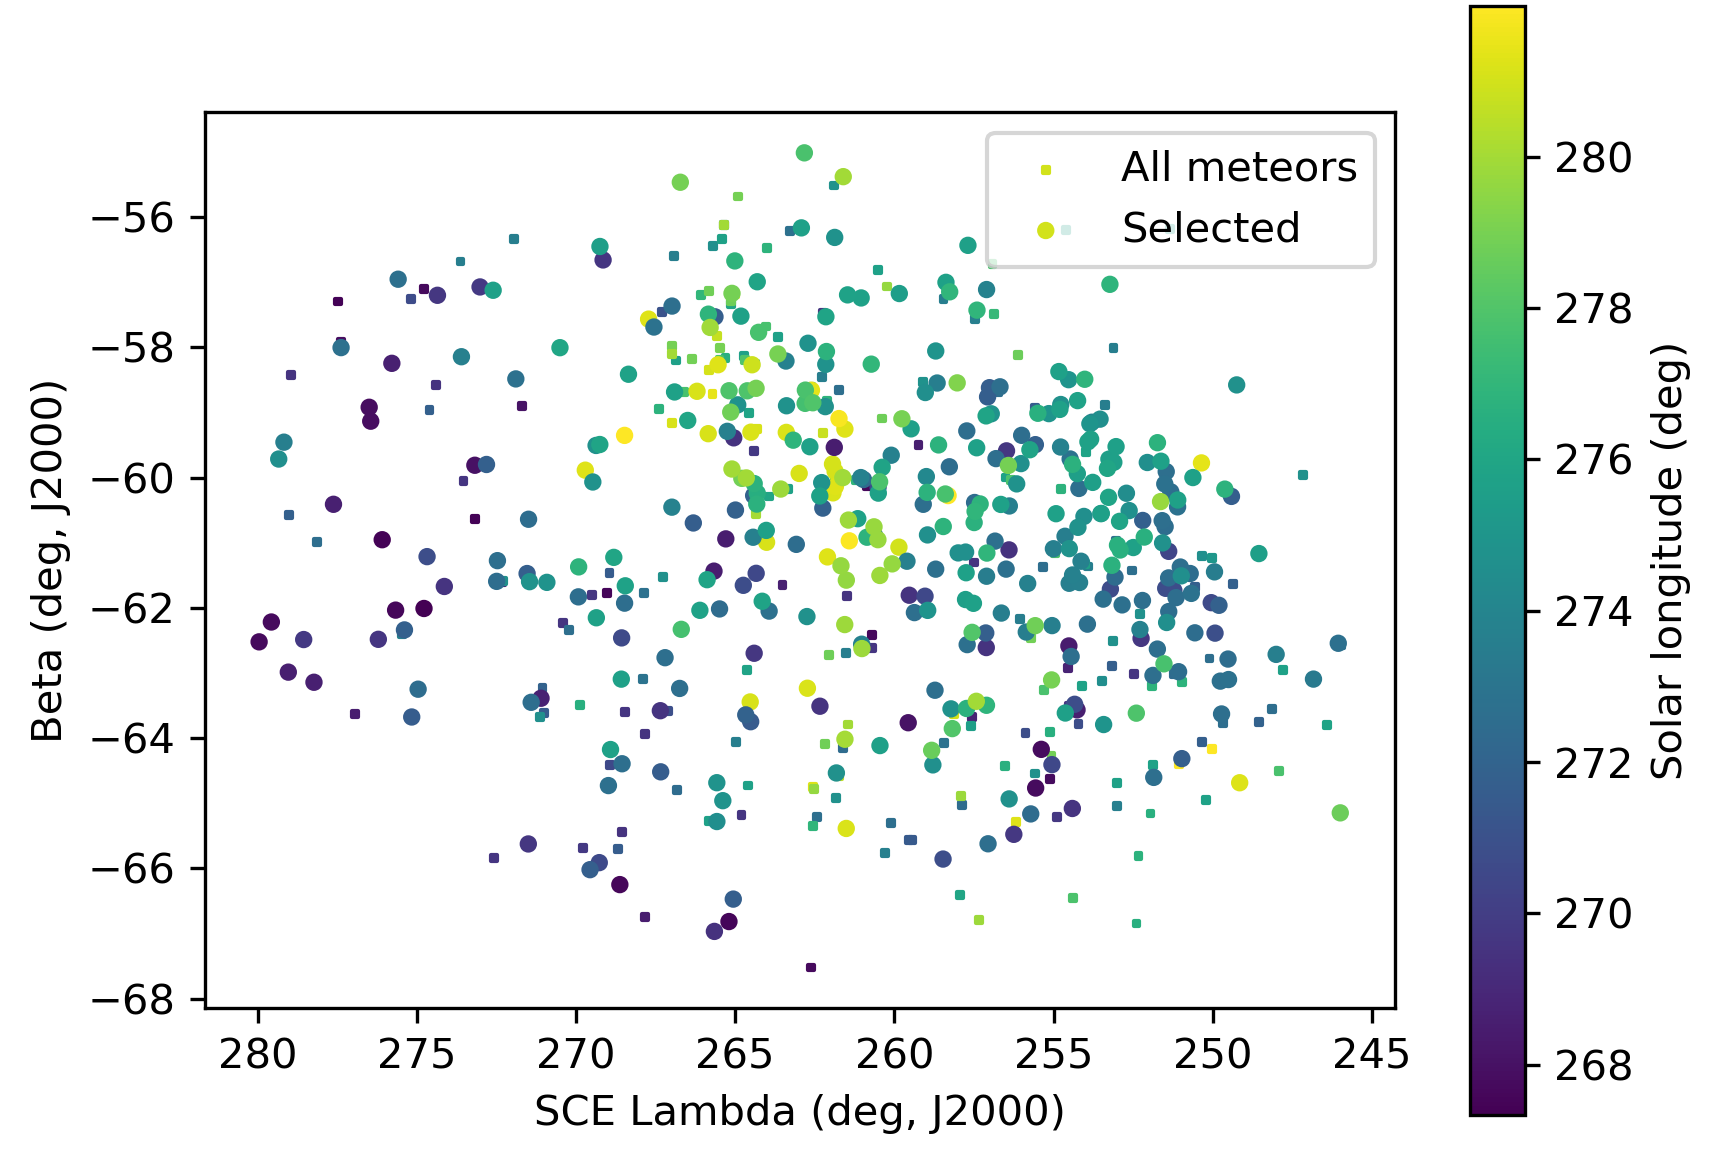
Figure 6 – The radiant distribution during the solar-longitude interval 267.5° – 281.5° in Sun centered geocentric ecliptic coordinates.
3 Shower classification based on orbits
A complete independent meteoroid stream search has been applied for confirmation based upon orbit data obtained between solar longitude 260.0° and 286.0° during the years 2019 to 2026. 316002 orbits were available within this time interval and a final mean orbit has been computed by the method of Jopek et al. (2006) for the thresholds according to the Rayleigh fit in Figure 7 with DSH < 0.125 and DD < 0.05 and DJ < 0.125 (Southworth and Hawkins, 1963; Drummond, 1981; Jopek, 1993. The results with the mean orbit based upon 326 meteors for 2020–2026 are listed in Table 1. The method has been described in detail in a separate publication (Roggemans et al., 2026a).
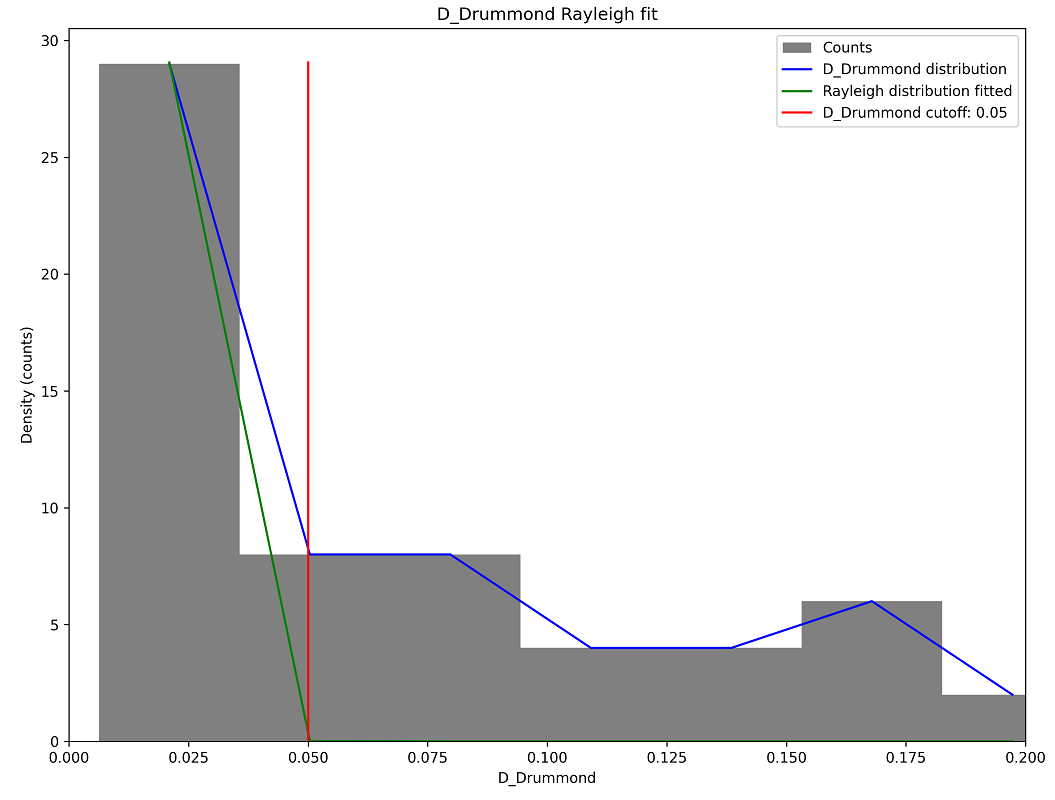
Figure 7 – Rayleigh fit on the Drummond criterion for kappa-Velids, 2025 data.
The radiant plot in equatorial coordinates (Figure 8) shows that the chosen similarity criteria fail to identify most of the likely kappa-Velids in the large cluster of radiant points. This means that the spread on the orbital elements is too large to represent the shower with a single mean orbit. Choosing more tolerant threshold values like DSH < 0.2 and DD < 0.08 and DJ < 0.2 (green dots in Figure 8) still fail to cover the large cluster of radiants and risk contaminating the selection with sporadic orbits.
The concentration above the KVE-radiant is caused by the mu-Velids (MVE#318) with a much higher eccentricity and retrograde orbit. Just right from the KVE-radiant are the e-Velids (EVE#746) which have their activity mainly before the kappa-Velids and a lower inclination orbit. Meteor shower activity is often a puzzle that requires detective work to distinguish between different activities.
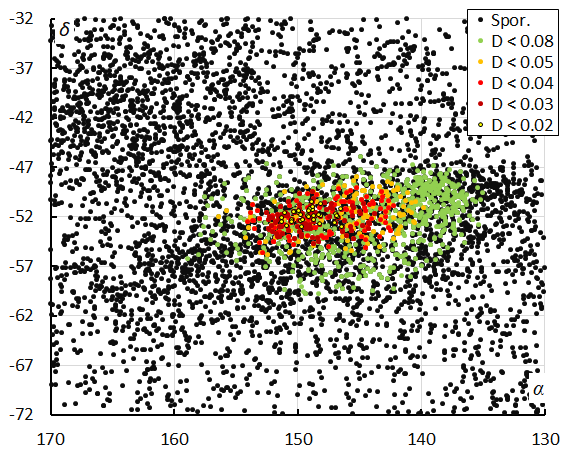
Figure 8 – The radiant distribution during the solar-longitude interval 260° – 286° in equatorial coordinates, color-coded for different threshold values of the combined similarity criteria.
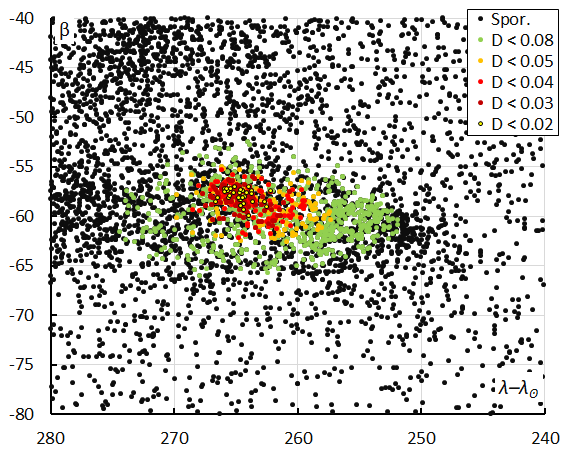
Figure 9 – The radiant distribution during the solar-longitude interval 260° – 286° in Sun-centered geocentric ecliptic coordinates, color-coded for different threshold values of the combined similarity criteria.
The Sun-centered ecliptic coordinates eliminate the radiant drift caused by the Earth moving on its orbit around the Sun (Figure 9), but also here the selected threshold to separate the kappa-Velids from the background fails to fit the entire shower. To the left from the KVE-radiant we see a cluster formed by the e-Velids and theta-Carinids (TCD#785) both with radiant, velocity and orbits that are hard to distinguish from the kappa-Velids. The cluster around λ–λʘ = 270° and β = –45° are the mu-Velids with a much faster velocity of vg = 56 km/s.
The orbit shower association method is not suitable for very diffuse showers with a large spread on the Kepler elements of the shower meteors. The orbit method will only identify a specific population of the particles in the stream according to their orbit similarity. The ratio of kappa-Velids relative to the overall activity reaches over 7% and should be notable by dedicated visual observers. Figure 10 shows the difference in activity profile between the recommended threshold class DSH < 0.125 and DD < 0.05 and DJ < 0.125 to exclude sporadic contamination (orange) and the more tolerant class with DSH < 0.2 and DD < 0.08 and DJ < 0.2 (green). Here the straightforward radiant classification method (red) appears to be the best compromise to cover the large diffuse radiant, despite sporadic contamination. No activity was detected before λʘ = 266.5°, and the best rates occurred at λʘ = 275.0°. The activity profile appears as a symmetric bell- shaped profile.
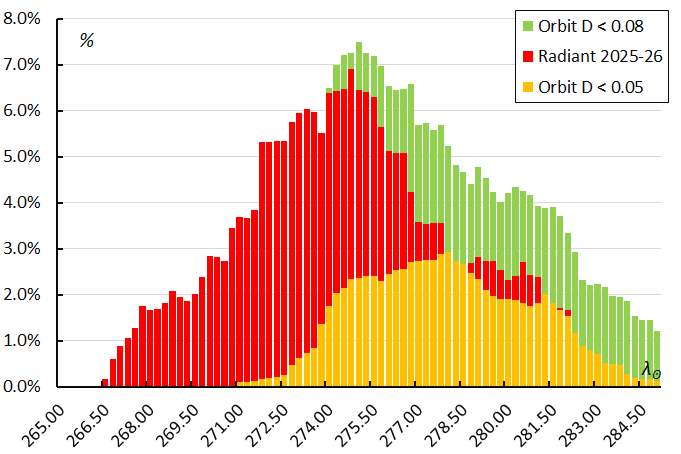
Figure 10 – The percentage of kappa-Velids relative to the total number of meteors, for the radiant method (2025–2026) and the orbit classification method 2020–2026.
4 Orbit and parent body
The diagram of the inclination i versus the Longitude of Perihelion Π shows a concentration in i, stretched in Π (Figure 11). The dense concentration at Π = 90°–100° and i = 65°–75° consists mainly of Quadrantids, December alpha-Draconids and M2025-Y1 related to the December kappa-Draconids. The eccentricity e versus the Longitude of Perihelion Π also appears stretched in Π (Figure 11). The spread in Longitude of Perihelion is caused by an increase in Longitude of Perihelion during the activity period (Figure 13). There is also a subtle increase in inclination (Figure 16). The other Kepler elements remain stable during the activity period. The meteoroid population is very dense in this range of eccentricities and perihelion distances (Figures 15 and 17). The cluster of KVE-orbits is best visible in the diagram inclination versus Longitude of Perihelion (Figure 11).
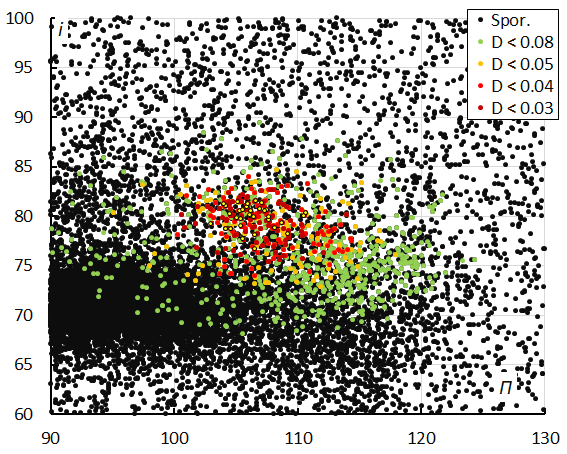
Figure 11 – Inclination i versus the longitude of perihelion Π color-coded for different classes of D-criteria thresholds, for λʘ between 260° and 286°. Spor. = sporadics.
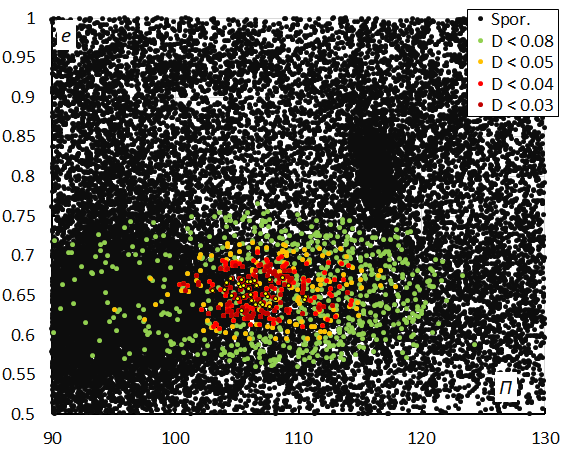
Figure 12 – Eccentricity e versus the Longitude of Perihelion Π color-coded for different classes of D-criteria thresholds, for λʘ between 260° and 286°. Spor. = sporadics.
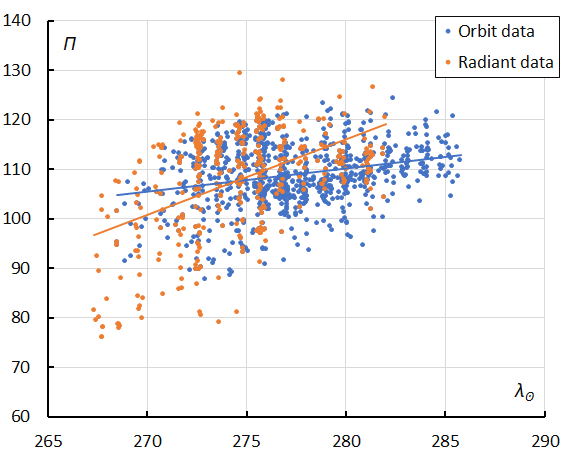
Figure 13 – The evolution of the Longitude of Perihelion Π in function of the solar longitude λʘ based upon the radiant method (2025–2026) and upon the orbit method (2020–2026).
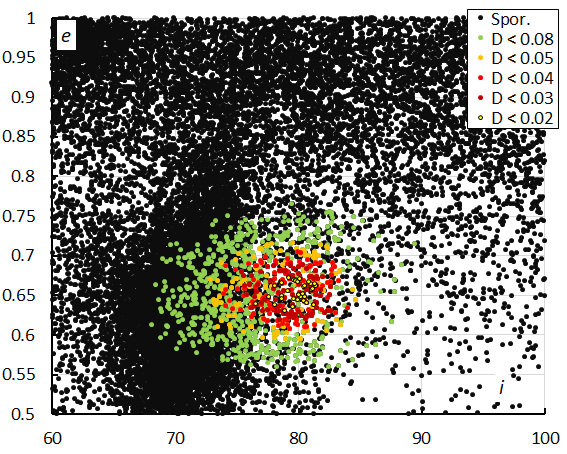
Figure 14 – Eccentricity e versus the inclination i color-coded for different classes of D-criteria thresholds, for λʘ between 260° and 286°. Spor. = sporadics.
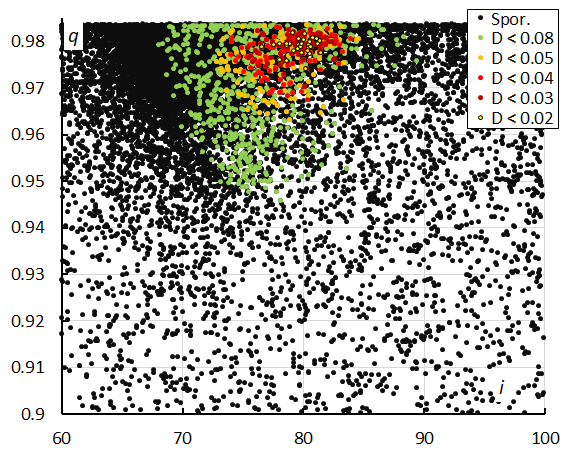
Figure 15 – Perihelion distance q versus the inclination i color-coded for different classes of D-criteria thresholds, for λʘ between 260° and 286°. Spor. = sporadics.
Figure 16 – The evolution of the inclination i in function of the solar longitude λʘ based upon the radiant method (2025–2026) and upon the orbit method (2020–2026).
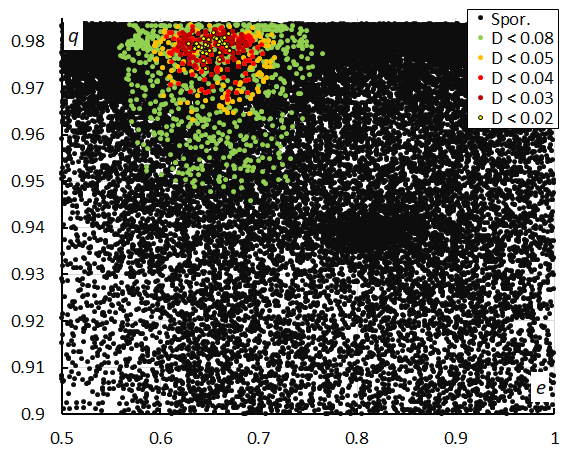
Figure 17 – Perihelion distance q versus the eccentricity e color-coded for different classes of D-criteria thresholds, for λʘ between 260° and 286°. Spor. = sporadics.
Table 1 – Comparing solutions obtained by the radiant method for 2025–2026, the orbit method 2020–2026 for DD < 0.08 and DD < 0.05, compared to the solution by Jenniskens (2023).
| Radiant 2025–26 | Orbit
DD < 0.08 |
Orbit
DD < 0.05 |
Jenniskens (2023) | |
| λʘ (°) | 275.0 | 276.8 | 277.6 | 278.2 |
| λʘb (°) | 267.0 | 268.0 | 271.8 | 270.0 |
| λʘe (°) | 282.0 | 286.0 | 284.2 | 285.0 |
| αg (°) | 141.8 | 145.4 | 148.3 | 146.9 |
| δg (°) | –51.8 | –51.9 | –52.1 | –52.7 |
| Δαg (°) | +0.65 | +0.82 | 0.85 | +0.89 |
| Δδg (°) | –0.07 | –0.45 | –0.41 | –0.36 |
| vg (km/s) | 42.0 | 43.3 | 44.3 | 44.4 |
| Hb (km) | 98.3 | 99.1 | 99.3 | 100.4 |
| He (km) | 88.0 | 88.3 | 88.5 | 87.4 |
| Hp (km) | 92.3 | 92.7 | 92.8 | 92.3 |
| MagAp | –0.3 | –0.4 | –0.4 | +1.4 |
| λg (°) | 175.3 | 179.8 | 181.6 | 181.4 |
| λg – λʘ (°) | 260.3 | 262.4 | 264.1 | 263.2 |
| βg (°) | –60.8 | –59.5 | –58.5 | –59.7 |
| a (A.U.) | 2.577 | 2.759 | 2.81 | 3.24 |
| q (A.U.) | 0.968 | 0.968 | 0.974 | 0.978 |
| e | 0.624 | 0.649 | 0.654 | 0.699 |
| i (°) | 74.3 | 77.0 | 78.8 | 78.1 |
| ω (°) | 13.4 | 11.6 | 9.8 | 9.4 |
| Ω (°) | 94.6 | 97.3 | 97.9 | 98.2 |
| Π (°) | 107.9 | 108.9 | 107.7 | 107.9 |
| Tj | 2.32 | 2.14 | 2.08 | 1.93 |
| N | 386 | 933 | 326 | 748 |
The same analysis applied to orbit data obtained from low light video cameras has been applied on the 2020-2023 SAAMER radar data. 477108 radar meteor orbits were extracted between solar longitudes 271° and 286°. The radar data represent a different dust population with much smaller sized particles that correspond to a limiting magnitude of +9 for SAAMER against +5 for low light video cameras. The radiant density maps in equatorial coordinates (Figure 18) and in Sun-centered ecliptic coordinates (Figure 19) differ a lot from the visual equivalents in Figures 8 and 9. The diagram with the inclination versus Longitude of Perihelion (Figure 20) shows the concentration of the KVE-orbits, but the other shower concentrations that are visible in the visual range (Figure 11) are barely visible.
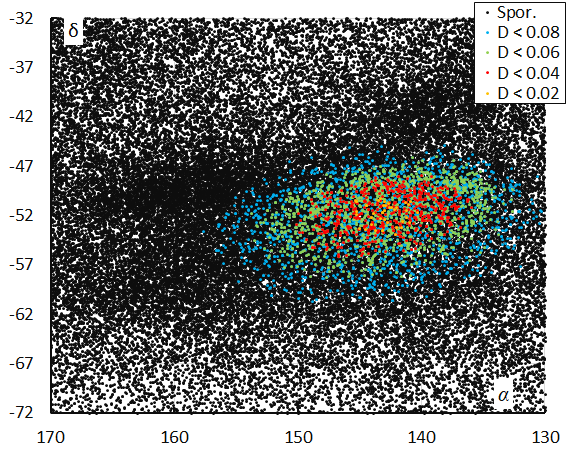
Figure 18 – The radiant distribution during the solar-longitude interval 271° – 286° in equatorial coordinates, color-coded for different threshold values of the combined similarity criteria (SAAMER 2020–2023).
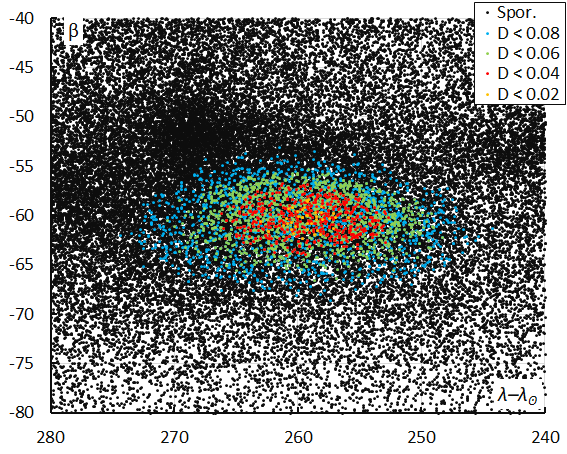
Figure 19 – The radiant distribution during the solar-longitude interval 271° – 286° in Sun-centered geocentric ecliptic coordinates, color-coded for different threshold values of the combined similarity criteria (SAAMER 2020–2023).
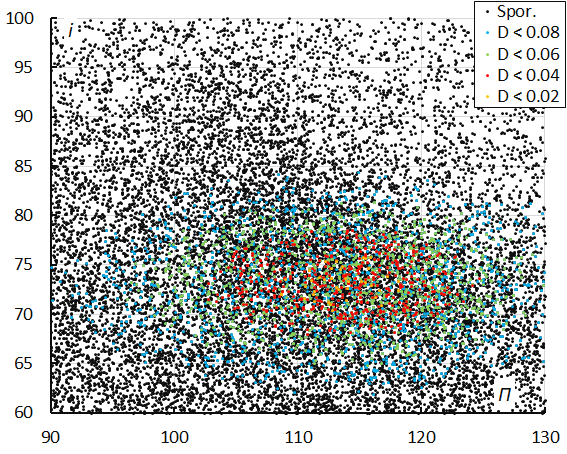
Figure 20 – Inclination i versus the Longitude of Perihelion Π color-coded for different classes of D-criteria thresholds, for λʘ between 271° and 286°. Spor. = sporadics (SAAMER 2020–2023).
The mean orbits have been calculated for 3143 SAAMER orbits that fulfill the D-criteria thresholds DSH < 0.2 and DD < 0.08 and DJ < 0.2, and 1730 orbits for the thresholds DSH < 0.15 and DD < 0.06 and DJ < 0.15. The results are compared to the original discovery data of the kappa-Velids and another solution derived by Greaves (2026) based upon the same SAAMER dataset of 2020–2023 (Table 2). The four solutions based upon radar data are in good agreement and differ mainly in geocentric velocity and the Kepler elements that strongly depend upon the velocity. The lower velocity results in a shorter semi-major axis, lower eccentricity and lower inclination.
Table 2 – Comparing solutions of the original discovery on SAAMER 2012–2015 radar data, the solution for 2020–2023 SAAMER radar data using the orbit method for DD < 0.08 and DD < 0.06, compared to the solution by Greaves (2026).
| Radar
2012–15 |
Radar
DD < 0.08 |
Radar
DD < 0.06 |
Greaves (2026) | |
| λʘ (°) | 276.0 | 277.1 | 276.8 | 276.0 |
| λʘb (°) | 272.0 | 271.6 | 271.6 | 272.1 |
| λʘe (°) | 286.0 | 286.1 | 286.1 | 280.3 |
| αg (°) | 141.1 | 143.1 | 143.0 | 140.8 |
| δg (°) | –51.0 | –51.7 | –51.5 | –50.8 |
| Δαg (°) | +1.24 | +0.82 | +0.87 | – |
| Δδg (°) | –0.48 | –0.49 | –0.46 | – |
| vg (km/s) | 40.5 | 40.4 | 40.5 | – |
| Hp (km) | – | 92.6 | 92.8 | – |
| λg (°) | 173.77 | 177.1 | 176.5 | 173.2 |
| λg – λʘ (°) | 257.77 | 259.5 | 259.3 | 257.2 |
| βg (°) | –60.48 | –60.2 | –60.2 | –60.4 |
| a (A.U.) | 2.08 | 1.96 | 1.98 | 2.05 |
| q (A.U.) | 0.965 | 0.962 | 0.962 | 0.963 |
| e | 0.536 | 0.510 | 0.513 | 0.531 |
| i (°) | 72.9 | 73.1 | 73.1 | 72.9 |
| ω (°) | 19.1 | 16.1 | 16.1 | 19.63 |
| Ω (°) | 96.0 | 97.3 | 97.3 | 95.77 |
| Π (°) | 115.1 | 113.5 | 113.5 | 115.4 |
| Tj | 2.82 | 2.96 | 2.94 | 2.85 |
| N | 806 | 3143 | 1730 | 500 |
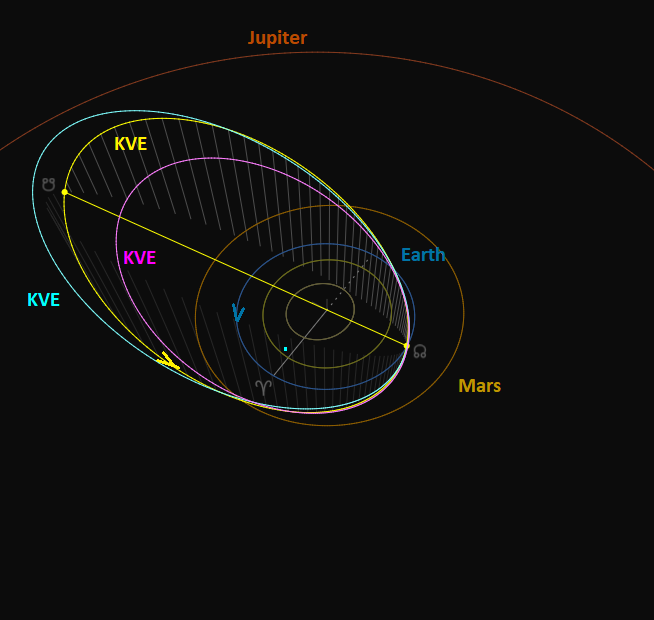
Figure 21 – Comparing the radiant determined kappa-Velids solution (yellow) with the orbit determined solution (blue) and the radar based mean orbit (pink). (Plotted with the Orbit visualization app provided by Pető Zsolt).
The Tisserand value TJ classifies the kappa-Velids as a Jupiter-family comet type stream. The meteoroids encounter the Earth from deep south of the ecliptic at the ascending node (Figure 21). The orbit similarity shower classification method filtered slower meteors out as the orbits failed to fit the D-criteria, resulting in a higher velocity selection, longer semi-major axis, larger eccentricity and higher inclination (blue orbit in Figure 21) This solution compares best to the CAMS solution. The radiant classification picks more meteors as kappa-Velids and includes many slightly slower meteors as shower members (yellow orbit). The radar-based solution (pink) is situated far inside the low light camera solutions. This is due to the mass-sorting effect as smaller particles with lower energy suffer more from solar radiation and lose angular momentum so that these slowly spiral to the Sun. This is known as the Poynting-Robertson Effect. The older the meteoroid stream, the stronger this mass sorting effect becomes. This, and the very diffuse structure of the kappa-Velids, indicates that this is an old stream.
A search for a possible parent body did not reveal any plausible candidate (Table 3)
The number of orbits per year reflects the growth of GMN in the Southern hemisphere from 2020 to 2024 (Table 4). The SAAMER radar data runs from 31 December 2019 till 2 January 2023. There is no indication for any episodic activity.
The annual activity should be strong enough to be noticed by visual observers. Naked eye observations picked the diffuse nature of this activity. One center of reasonably strong activity was identified from approximately 20 through to 30 December (267°–277° in solar longitude) with an apparent radiant around RA 135 ± 10°, Decl. –47 ± 7°, at maximum which was on 25 or 26 December (λʘ = 274°) uncorrected visual rates were 3 to 4 meteors per hour. This radiant area activity was first observed by Williams in 1886 and later by most of the Southern Hemisphere observers thereafter. The shower was well monitored between 1971 and 1986 by M. Clark, D. Skelsey, M. Buhagiar and WAMS/NAPOMS.
A second activity was observed from about 29 December to 15 January (277° to 295° in solar longitude) with a broad maximum of 5 to 7 per hour from 6 to 8 January. The radiant position at maximum was RA 125 ± 10° and Decl. –47 ± 7°). This activity differs in radiant position and activity period from the kappa-Velids.
Table 3– Top ten matches of a search for possible parent bodies with DD < 0.25, based upon the mean orbit derived from the radiant classification method.
| Name | DD |
| 2017 YN3 | 0.152 |
| 2023 GZ1 | 0.213 |
| 2014 UF206 | 0.213 |
| 2020 WS5 | 0.219 |
| 2009 HV58 | 0.226 |
| 2018 XQ3 | 0.229 |
| (523967) 1998 YR11 | 0.235 |
| 2022 WC12 | 0.235 |
| 2024 VW3 | 0.241 |
| 2024 XB4 | 0.242 |
Table 4 – Number of kappa-Velid orbits detected by GMN and SAAMER per year.
| Year | GMN
DD < 0.08 |
GMN
DD < 0.05 |
SAAMER DD < 0.08 | SAAMER DD < 0.06 |
| 2019 | – | – | 60 | 31 |
| 2020 | 2 | 2 | 1109 | 590 |
| 2021 | 23 | 11 | 994 | 541 |
| 2022 | 79 | 23 | 966 | 564 |
| 2023 | 44 | 12 | 14 | 4 |
| 2024 | 386 | 131 | – | – |
| 2025 | 365 | 133 | – | – |
| 2026 | 34 | 14 | – | – |
5 Conclusions
This GMN meteoroid orbit data case study confirms the existence of the kappa-Velids. The solution has been checked by using two independent shower identification methods as a two-factor authentication for the validation of the analysis. The diffuse nature of this meteoroid stream with a very large radiant area and large spread on the orbital parameters proves to be a challenge to distinguish the kappa-Velids from the sporadic background by using the radiant classification method. The orbit classification method based upon D-criteria identifies only a portion of the actual number of kappa-Velids as the spread on the Kepler elements in the shower is too large to fulfill these orbital similarity criteria. The solutions are a trade-off between rejecting as many sporadics as possible and the selection of a statistical relevant number of kappa-Velids to approach a representative mean orbit.
Since the shower was first discovered based upon radar data from SAAMER, an attempt was made to compare the results based upon low-light video camera data with limiting magnitude +5 and the radar data with limiting magnitude +9 which consists of a different population in mass. The radar data yield a much shorter orbit far inside the orbit derived from GMN data. Physically this can be explained as the result of smaller dust particles spiraling towards the Sun caused the Poynting-Robertson effect. This indicates that this dust stream is probably very old and already heavily perturbed and dispersed.
The IAU-MDC Working List of Meteor showers list all solutions derived from different observing techniques. To some extend this is like comparing apples with oranges as each solution strongly depends upon the activity period covered, the mass range that has been observed and the shower classification methodology that has been used. The GMN solutions are based upon the computed mean orbit while other researchers use average or median values of the Kepler elements, which can result in a calculated orbit that does not cross the Earth orbit.
Our independent solutions based upon SAAMER and GMN data have been reported to the IAU-MDC, and the shower now fulfils the criteria for being upgraded to be nominated for established status.
Acknowledgments
This report is based on the data of the Global Meteor Network (Vida et al., 2020a; 2020b; 2021) which is released under the CC BY 4.0 license. We thank all 927 participants in the Global Meteor Network project for their contribution and perseverance. A list with the names of the volunteers who contribute to GMN has been published in the 2025 annual report (Roggemans et al., 2026b). The following 317 cameras contributed to paired meteors used in this study:
AU0001, AU0002, AU0003, AU0004, AU0006, AU0007, AU0009, AU000A, AU000B, AU000C, AU000D, AU000E, AU000F, AU000G, AU000H, AU000J, AU000K, AU000L, AU000Q, AU000R, AU000S, AU000T, AU000U, AU000V, AU000W, AU000X, AU000Y, AU000Z, AU0010, AU001A, AU001B, AU001C, AU001D, AU001E, AU001F, AU001K, AU001L, AU001N, AU001P, AU001Q, AU001R, AU001S, AU001U, AU001V, AU001W, AU001X, AU001Y, AU001Z, AU0028, AU0029, AU002A, AU002B, AU002C, AU002D, AU002E, AU002F, AU0030, AU003C, AU003E, AU003G, AU003H, AU003J, AU0040, AU0041, AU0042, AU0043, AU0046, AU0047, AU0048, AU004A, AU004B, AU004H, AU004J, AU004K, AU004L, AU004M, AU004Q, AU004R, BR0001, BR0002, BR0003, BR000A, BR000F, BR000G, BR000J, BR000Q, BR000T, BR0013, BR0015, BR001F, BR001Q, BR001T, BR001U, BR001W, BR001Z, BR002A, BR002B, BR002C, ES0002, ES0003, KR0004, KR0010, KR0015, MX0001, MX0002, MX0003, MX0006, MX000B, MX000E, MX000F, NZ0001, NZ0002, NZ0003, NZ0004, NZ0006, NZ0007, NZ0008, NZ0009, NZ000B, NZ000D, NZ000F, NZ000G, NZ000H, NZ000J, NZ000K, NZ000M, NZ000N, NZ000P, NZ000Q, NZ000S, NZ000T, NZ000U, NZ000V, NZ000W, NZ000X, NZ000Y, NZ000Z, NZ0010, NZ0011, NZ0012, NZ0013, NZ0014, NZ0015, NZ0016, NZ0017, NZ0018, NZ0019, NZ001A, NZ001C, NZ001E, NZ001F, NZ001G, NZ001H, NZ001J, NZ001L, NZ001N, NZ001P, NZ001Q, NZ001R, NZ001S, NZ001V, NZ001W, NZ001X, NZ001Y, NZ001Z, NZ0020, NZ0021, NZ0022, NZ0023, NZ0024, NZ0025, NZ0026, NZ0027, NZ0028, NZ0029, NZ002C, NZ002D, NZ002E, NZ002F, NZ002G, NZ002H, NZ002J, NZ002K, NZ002L, NZ002M, NZ002N, NZ002P, NZ002Q, NZ002R, NZ002S, NZ002T, NZ002U, NZ002V, NZ002W, NZ002X, NZ002Y, NZ002Z, NZ0030, NZ0032, NZ0033, NZ0034, NZ0035, NZ0036, NZ0037, NZ0038, NZ0039, NZ003A, NZ003B, NZ003C, NZ003E, NZ003F, NZ003G, NZ003H, NZ003K, NZ003N, NZ003Q, NZ003R, NZ003S, NZ003T, NZ003U, NZ003V, NZ003W, NZ003X, NZ003Y, NZ003Z, NZ0040, NZ0041, NZ0042, NZ0044, NZ0045, NZ0046, NZ0049, NZ004A, NZ004B, NZ004C, NZ004D, NZ004E, NZ004H, NZ004J, NZ004L, NZ004M, NZ004N, NZ004R, NZ004S, NZ004T, NZ004U, NZ004V, NZ004W, NZ004X, NZ004Y, NZ004Z, NZ0051, NZ0059, NZ005A, NZ005B, NZ005C, NZ005D, NZ005E, NZ005F, NZ005G, NZ005H, NZ005J, NZ005K, NZ005L, NZ005M, NZ005N, NZ005Q, NZ005R, NZ005S, NZ005T, NZ005U, NZ005Y, NZ005Z, NZ0061, NZ0063, NZ0065, NZ0066, NZ0067, NZ0068, NZ0069, NZ006F, NZ006G, NZ006K, US0004, US0005, US000A, US000C, US000G, US000H, US000L, US000P, US000S, US000U, US000V, US001Q, US001R, US0021, US002W, US002X, US002Y, US004Q, US005D, US005F, US0061, USL001, USL002, USL005, USL008, USL00B, USL00E, USL00M, USL00P, USL00X, USL011, USL012, USL013, USL016, USL01A, USL01D, ZA0001, ZA0002, ZA0006, ZA0007, ZA0008, ZA000C, ZA000F and ZA000G.
References
Drummond J. D. (1981). “A test of comet and meteor shower associations”. Icarus, 45, 545–553.
Greaves J. (2026). “Independent confirmation of meteor shower candidates from the Southern Argentine Agile Meteor Radar”. eMetN Meteor Journal, 11, 151–153.
Jenniskens P. (2023). Atlas of Earth’s meteor showers. Elsevier, Cambridge, United states. ISBN 978-0-443-23577-1. Page 511.
Jopek T. J. (1993). “Remarks on the meteor orbital similarity D-criterion”. Icarus, 106, 603–607.
Jopek T. J., Rudawska R. and Pretka-Ziomek H. (2006). “Calculation of the mean orbit of a meteoroid stream”. Monthly Notices of the Royal Astronomical Society, 371, 1367–1372.
Moorhead A. V., Clements T. D., Vida D. (2020). “Realistic gravitational focusing of meteoroid streams”. Monthly Notices of the Royal Astronomical Society, 494, 2982–2994.
Pokorný P., Janches D., Brown P. G., Hormaechea J. L. (2017). “An orbital meteoroid stream survey using the Southern Argentina Agile MEteor Radar (SAAMER) based on a wavelet approach”. Icarus, 290, 162–182.
Roggemans P., Vida D., Šegon D., Scott J.M., Wood J. (2026a). “2025 outburst of the Volantids (VOL#758)”. eMetN Meteor Journal, 11, 135–141.
Roggemans P., Vida D., Šegon D., Scott J.M. (2026b). “Meteoroid orbit shower identification”. eMetN Meteor Journal, 11, TBP.
Roggemans P., Campbell-Burns P., Kalina M., McIntyre M., Scott J. M., Šegon D., Vida D. (2026c). “Global Meteor Network report 2025”. eMetN Meteor Journal, 11, 89–129.
Southworth R. B. and Hawkins G. S. (1963). “Statistics of meteor streams”. Smithsonian Contributions to Astrophysics, 7, 261–285.
Vida D., Gural P., Brown P., Campbell-Brown M., Wiegert P. (2020a). “Estimating trajectories of meteors: an observational Monte Carlo approach – I. Theory”. Monthly Notices of the Royal Astronomical Society, 491, 2688–2705.
Vida D., Gural P., Brown P., Campbell-Brown M., Wiegert P. (2020b). “Estimating trajectories of meteors: an observational Monte Carlo approach – II. Results”. Monthly Notices of the Royal Astronomical Society, 491, 3996–4011.
Vida D., Šegon D., Gural P. S., Brown P. G., McIntyre M. J. M., Dijkema T. J., Pavletić L., Kukić P., Mazur M. J., Eschman P., Roggemans P., Merlak A., Zubrović D. (2021). “The Global Meteor Network – Methodology and first results”. Monthly Notices of the Royal Astronomical Society, 506, 5046–5074.