Abstract: The “Meteor Shower Database” created using data from the SonotaCo network was revised (Koseki, 2021) and expanded using the Global Meteor Network (GMN) data. The number of meteors used by GMN (Global Meteor Network) was 760874, significantly increasing from the previous 2007–2018 SonotaCo net’s 284273 meteors. Furthermore, the number of meteor showers detected increased from 82 to 118 since observations of the southern sky were now included. The summarized data is shown in Table 7.
1 Introduction
About three years ago, we published “Meteor Shower Database” using data from the SonotaCo network (Koseki, 2021). Since then, the GMN has become more active, including in the Southern Hemisphere, and meanwhile more than a million meteor orbits have been accumulated (Vida et al., 2019, 2020; 2021). This time, we decided to use GMN’s data until February 2023 (downloaded 2023–02–25, at 00h35m46.416729s UTC) to revise and expand the previously announced “Meteor Shower Database”.
This paper consists of three parts: I. Research methods and survey results, II. Meteor showers that need to be examined carefully, and III. Radiant point distribution map and activity profile. In this Part I, the radiant point, geocentric velocity, and orbital elements at the maximum are shown in Table 7. In Part II, we explained meteor showers that may cause misunderstandings when consulted only in Parts I and III, focusing on those that are confusing in IAUMDCSD. Part III will also touch on the differences in the “definitions of meteor showers” between SonotaCo net and GMN .
We published in eMeteorNews a 10-level rating for every entry listed in IAUMDCSD (March 29, 20h00m00s UTC, 2023 revised edition), and we will focus on those with a rating of 8 or higher. Basically, the average DR is 5 or more and the maximum number of meteors per day is 10 or more. We also considered some of the interesting activities that were below 7. The survey items are the same as last time, but the survey procedure will be explained using the Orionids as an example.
2 Research methods
2.1 Select data that appears to be representative for the IAUMDCSD list
If the described data are in good agreement, such as the Orionids, use the first report.
0008ORI00: λʘ = 208.7°, λ –λʘ = 246.56°, β = –7.45°
If there are discrepancies in the data listed, we use the best 10-level rating created earlier.
2.2 If the position of the radiant point (λ – λʘ, β) does not change with the solar longitude, we will create a temporary radiant point distribution and activity graph
Figure 1 (left) and Figure 2 (left) show the radiant point distribution and activity graph using the original data as is. If the radiant point distribution is expressed in equatorial coordinates (α, δ), the drift of the radiant points becomes large, making it difficult to approximate the spherical coordinates of the celestial sphere with a straight line on a plane. By using (λ – λʘ, β) coordinates, the amount of movement is small, and a reasonable linear approximation is possible. The radiant point distribution shown here is based on data with an initial value of Δλʘ = 10°, that is λʘ = 198.7°~218.7°.
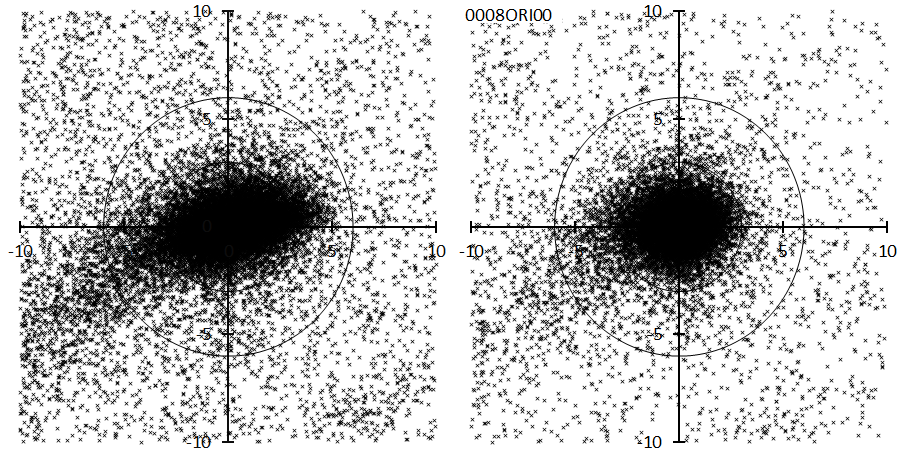
Figure 1 – The left side is the original data, and the right side is the one with the radiant point movement taken into account.
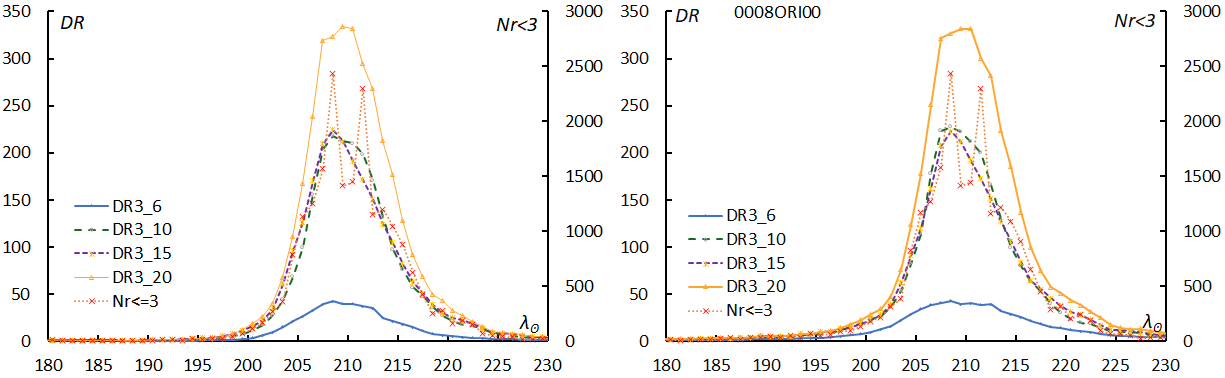
Figure 2 – The left side assumes that the radiant point is fixed in ecliptic coordinates, and the right side assumes that the radiant point moves.
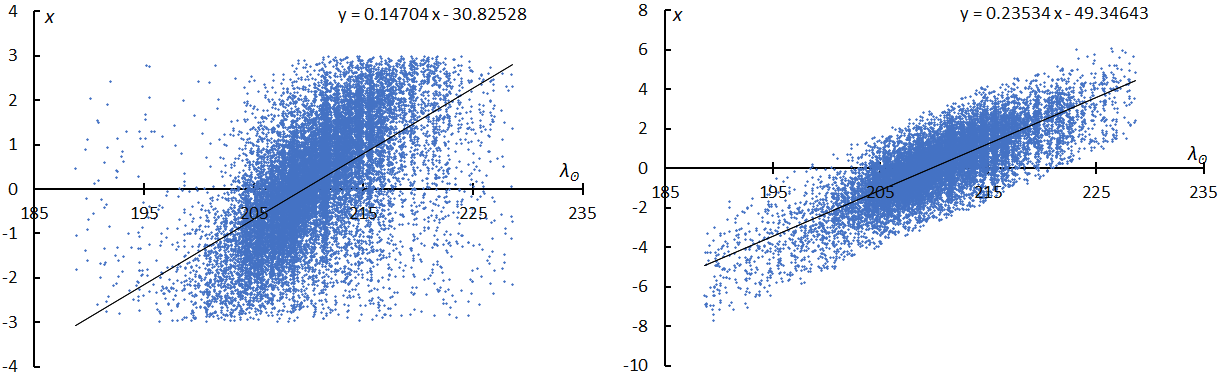
Figure 3 – Changes in the x-coordinate of the radiant point depending on the solar ecliptic longitude. The left is the original data, and the right is the converged state of the regression analysis.
2.3 For the activity period estimated from the activity graph, we use a regression analysis to find changes in the position of the radiant point (λ – λʘ, β) and the geocentric velocity with the solar ecliptic longitude
Judging from the activity graph, Δλʘ = 10°, which we used as the initial value, is appropriate, so we perform a regression analysis for observations in this range. We use data within 3 degrees from the center and ±3 (km/s) from the regression line of the geocentric velocity.
The distribution before the analysis is cut off at the top and bottom because the radius of the radiant point is set to 3 degrees and does not include the entire movement of the radiant point (Figure 3, left). After several operations, the regression line converges to a constant value (Figure 3, right).
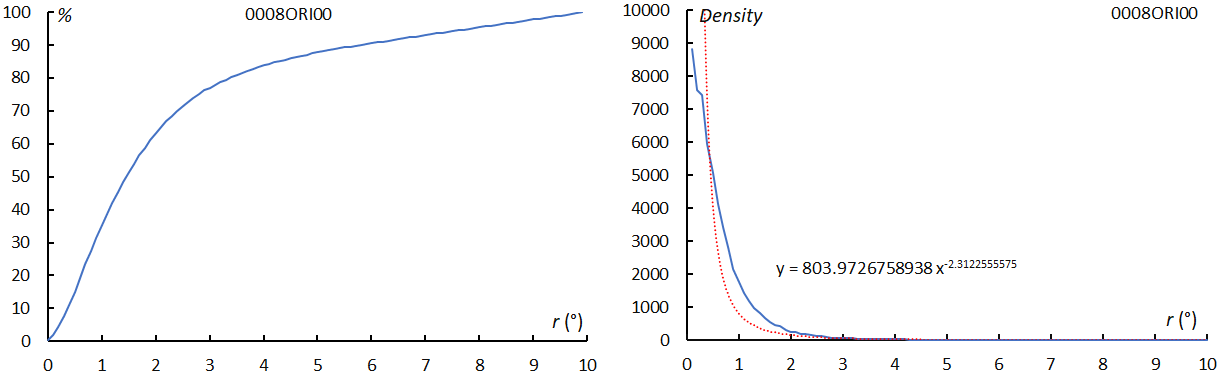
Figure 4 – The total number of radiant points within 10 degrees from the center against the ratio of the number of radiant points to each distance (left). The change in radiant density with the distance in steps of 0.1 degrees (right).
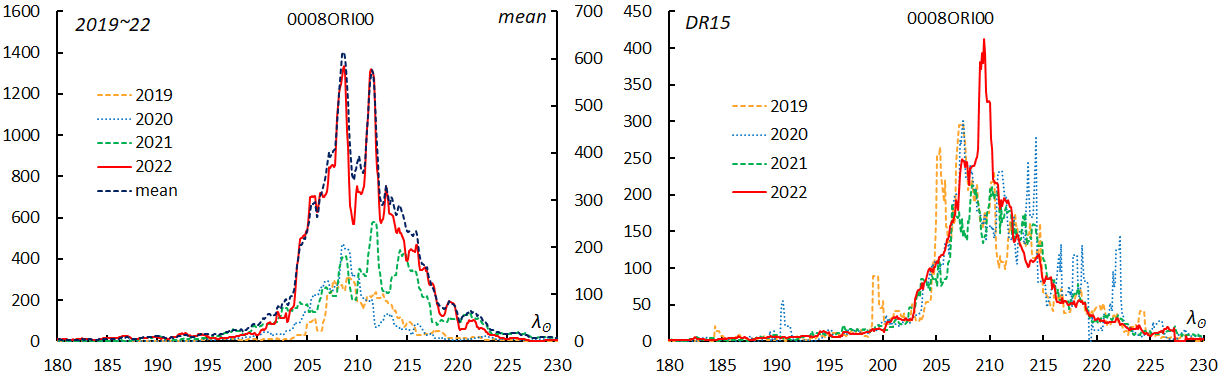
Figure 5 – Activity curve by year. On the left is the change in the number of meteors determined to be part of the Orionid group. The image on the right is corrected by DR.
2.4 A radiant point distribution map and activity profile are created based on the determined radiant shift
Figures 1 and 2 (both right) show the recalculations of the radiant distribution and activity curve using the estimates of radiant movement obtained by regression analysis, respectively. The radiant distribution is almost circular, and the so-called “tail of the Orionis” is clearly visible. Furthermore, as shown in Figure 4 (left), 80% of the radiant points of the Orionids are included within 3.0 degrees, and 90% when included up to 5.6 degrees. This shows the validity of considering radiant points within 3 degrees from the center to belong to a meteor shower.
Figure 4 (right) shows the change in radiant point density with distance from the center, and the change is almost exponential. The structure of radiant points is actually complex, and it is best not simply expressed as an exponential function, but by expressing it in the form of N = a*rb, it is possible to give a certain index of the density and spread of the radiant point distribution; when r is the distance from the radiant, a and b can be indicators of the density of the radiant at the center and how the radiant spreads, respectively.
Although the activity curves in Figure 2 are similar, it is possible to trace activity even outside the survey period λʘ =198.7°~218.7°, and the values for DR and Nr <= 3 are increasing. It is necessary to consider which of the activity curves in Figure 2 (right) best represents the activity. Two conditions need to be taken into consideration: one is that if the number of meteors is used as is, it will be affected by observation conditions (weather, etc.), and the other is that even if DR is used to alleviate the influence of observation conditions, it will be affected by the influence of the nearby activity of meteor showers.
Figure 5 (left) gives the activity profile based on the number of meteors expressed as a moving mean of 0.1 degrees in
1-degree width in solar longitude. Figure 5 indicates the cause of the problem in which Nr <= 3 (the number of Orionid meteors), Figure 2 shows two maxima. Figure 5 (left) shows that the observations of 2022 dominate the average value among GMN observations. We should be careful that the content of this paper is dominated by the 2022 observations (or 2023 if there are 2023 observations) because the number of GMN observations is increasing exponentially. Observations of the Orionids in 2022 show two maxima in Figure 5 (left), but a single maximum in DR15 in Figure 5 (right). This suggests that the influential Western observations of GMN were obstructed for some reason (probably the weather), and it shows that the two maxima were spurious.
If the number of meteors itself is used carelessly in this way, it will lead to incorrect conclusions, so it is necessary to use DR correction together. However, as mentioned earlier, DRs are affected by surrounding meteor activity. Figure 6 shows the change in the number of radiant points within a 0.1-degree wide ring depending on the distance from the center, considering the radiant shift. The number of radiant points of the Orionids decreases when moving away from the center but starts to increase again from around 6 degrees. This is a natural increase due to an increase in the surface of the 0.1-degree wide ring. The slight increase around 15 degrees is due to the EGE meteor shower, and the increase after 45 degrees is due to the STA and NTA radiants. The activity of the Orionids is very strong and is not affected by EGE much, but it is a point that should be taken into consideration when obtaining the activity profile of the weak meteor shower. In the case of the Orionids, it is clear from Figure 2 (right) that DR3_6 is inappropriate, and DR3_10 would be better to avoid the impact of EGE. The area of the ring used for DR calculation increases as the distance from the center increases, and therefore the number of radiant points also increases. If the surrounding meteor activity level is low, the larger the number of meteors, the smaller the variation in DR. In such a case, DR3_20 is the most appropriate.
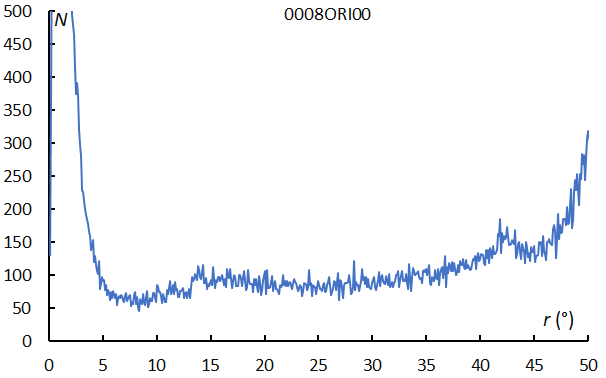
Figure 6 – The change in the number of radiant points every 0.1 degree depends on the distance from the center considering the movement of the radiant point.
Regardless of whether Nr <= 3 or DR is taken, the activity profile obtained is not smooth because the activity of the meteor shower cannot be constant from year to year, and the observation conditions vary. A simplified model of the structure of meteoroid streams is used to estimate the average activity curve.
The model A: The direction of the perihelion and the size of the orbit are assumed to be constant, the orbital plane of the meteoroid stream rotates around the direction of the perihelion, and the eccentricity changes, so the meteor shower activity can be seen at different solar longitudes.
The rotation model: The size and shape of the orbit (eccentricity) are assumed to be constant, and the orbital plane of the meteor stream rotates along the ecliptic plane (the ecliptic latitude of the perihelion is constant), so the meteor shower is active even at different solar longitudes.
We apply the D-criterion, which is often used to determine the attribution of meteor showers, to these two models. The Southworth-Hawkins D-criterion (1963) is expressed in the following form:
D^2 = (ΔS) ^2 + (ΔV)^2 + (ΔP) ^2 + (θ)^2
Where:
- ΔS is the difference in orbit shape;
- ΔV is the difference in orbit size;
- ΔP is the difference in perihelion direction;
- θ is the intersection angle of mutual orbital planes.
For the A model, the second and third terms are considered constant, so the first and fourth terms are used, and for the rotation model, the first and second terms are considered constant, so the third and fourth terms are used. The coefficient of each term is 1 in the D-criterion, but here we assign coefficients C1 and C2 to the terms used, respectively. Also, in the D-criterion, the power of each term is fixed at 2, but the power C3 is added to the entire sum of two terms. By adjusting the coefficients and powers, almost the same activity profiles for the A model and the Rotation model can be obtained for the Orionids (Figure 7). Table 1 shows the coefficients used in the estimated profiles shown in Figure 7 for the Orionids. It should be noted that since model A and the rotation model use different terms, it is meaningless to compare C1 and C2 between them.

Figure 7 – The Orionid group activity curve according to the different model estimates.
Table 1 – Coefficients used to represent the estimated profile in Figure 7.
| C1 | C2 | C3 | λʘ | Max | |
| A | 37 | 37 | 1.3 | 209.5 | 320 |
| Rotation | 10 | 10 | 1.3 | 209.5 | 320 |
2.5 Estimation of the radiant point and orbit calculation
It is easy to convert the movement of the radiant point in (x, y) coordinates to (λ – λʘ, β) and then to (α, δ) coordinates, and when combined with the estimated value of the geocentric velocity, orbit changes can also be estimated. Coordinate transformation and orbit calculation methods are also extensively described elsewhere, so they will be omitted here. Changes in the radiant point, geocentric velocity, and orbital elements of the Orionids are shown in Table 2.
Table 2 – The radiant point, geocentric velocity, and orbital elements of the Orionids.
| λʘ | λ–λʘ | β | α | δ | vg | e | q | i | ω | Ω | λπ | βπ | a |
| 190 | 251.3 | –8.8 | 81.2 | 14.3 | 66.9 | 0.91 | 0.703 | 162.6 | 67.9 | 10 | 303 | 16.1 | 7.8 |
| 191 | 251.1 | –8.8 | 81.9 | 14.4 | 66.9 | 0.909 | 0.696 | 162.7 | 68.8 | 11 | 303.1 | 16.1 | 7.69 |
| Omitted | |||||||||||||
| 205 | 247.7 | –7.8 | 92.7 | 15.6 | 65.9 | 0.913 | 0.591 | 163.6 | 81.5 | 25 | 303.8 | 16.3 | 6.76 |
| 206 | 247.4 | –7.8 | 93.5 | 15.6 | 65.8 | 0.913 | 0.583 | 163.6 | 82.4 | 26 | 303.9 | 16.2 | 6.73 |
| 207 | 247.2 | –7.7 | 94.3 | 15.7 | 65.7 | 0.914 | 0.576 | 163.7 | 83.3 | 27 | 304 | 16.2 | 6.7 |
| 208 | 246.9 | –7.6 | 95.1 | 15.7 | 65.7 | 0.915 | 0.568 | 163.7 | 84.1 | 28 | 304.1 | 16.2 | 6.68 |
| 209 | 246.7 | –7.6 | 95.9 | 15.7 | 65.6 | 0.916 | 0.561 | 163.8 | 85 | 29 | 304.2 | 16.1 | 6.66 |
| 210 | 246.5 | –7.5 | 96.6 | 15.8 | 65.5 | 0.917 | 0.553 | 163.9 | 85.9 | 30 | 304.3 | 16.1 | 6.64 |
| 211 | 246.2 | –7.4 | 97.4 | 15.8 | 65.4 | 0.918 | 0.546 | 163.9 | 86.7 | 31 | 304.4 | 16 | 6.63 |
| 212 | 246 | –7.4 | 98.2 | 15.8 | 65.4 | 0.919 | 0.539 | 164 | 87.6 | 32 | 304.5 | 16 | 6.62 |
| 213 | 245.7 | –7.3 | 99 | 15.9 | 65.3 | 0.92 | 0.531 | 164.1 | 88.4 | 33 | 304.7 | 15.9 | 6.61 |
| 214 | 245.5 | –7.2 | 99.8 | 15.9 | 65.2 | 0.921 | 0.524 | 164.1 | 89.2 | 34 | 304.8 | 15.9 | 6.6 |
| Omitted | |||||||||||||
| 229 | 241.8 | –6.2 | 111.5 | 15.7 | 64.2 | 0.94 | 0.417 | 165.2 | 101.2 | 49 | 307.4 | 14.5 | 6.93 |
| 230 | 241.6 | –6.1 | 112.3 | 15.7 | 64.1 | 0.941 | 0.41 | 165.3 | 102 | 50 | 307.6 | 14.4 | 6.98 |
It is noteworthy that the perihelion direction (λπ, βπ) and the semimajor axis a of the Orionids remain almost constant. There are many cases where the perihelion direction and semi-major axis of the orbit change significantly.
In Section 2, we have shown the coordinates of the center used in calculations and the change of the radiant point in (x, y) coordinates and the geocentric velocity, so we will only show the radiant point and trajectory at the estimated maximum.
2.6 Investigation of nearby activities
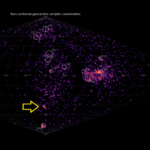
Figure 8 shows the meteor showers listed in the IAUMDSD under the same conditions as Figure 1 (right). The red squares are registered as the Orionids and are well concentrated in the center. Among minor meteor showers, even those registered in the IAUMDCSD vary greatly, often in a confusing way. Crosses indicate that other names have been given in IAUMDCSD.
Table 3 – Meteor showers recorded in the IAUMDCSD in the same area as Figure 1 (right).
| Code | λʘ | λ–λʘ | b | vg | x | y |
| 0718XGM00 | 206 | 250.9 | –10.6 | 68.1 | –3.37 | –2.81 |
| 1198XRO00 | 207.1 | 245.7 | –7.7 | 50.3 | 1.47 | –0.04 |
| 0008ORI03 | 207.5 | 247.1 | –7.9 | 66.4 | –0.01 | –0.18 |
| 0008ORI04 | 207.9 | 247.5 | –7.8 | 66.2 | –0.48 | –0.19 |
| 0008ORI05 | 208 | 247.4 | –8.1 | 65.4 | –0.42 | –0.5 |
| 0008ORI01 | 208.6 | 246.6 | –7.4 | 66.2 | 0.15 | 0.16 |
| 0008ORI00 | 208.7 | 246.6 | –7.5 | 66.5 | 0.21 | 0.15 |
| 0008ORI06 | 209 | 246.7 | –7.6 | 66.3 | –0.03 | –0.04 |
| 0008ORI02 | 209.8 | 246.3 | –7.2 | 66.4 | 0.2 | 0.31 |
1198XRO is located within 3 degrees from the center (x, y) = (1.47, –0.04). Since it was 15km/s slower than the Orionids, vg = 50.3, it was probably considered as a different activity. The existence of separate groups has been argued because of the difference in geocentric velocity between the main activity, but neither has been confirmed. This will probably be the same case here. 0718XGM is a member of the so-called “tail of the Orionids” and careful discussion will be necessary as to whether they should be recognized as an independent meteor showers.
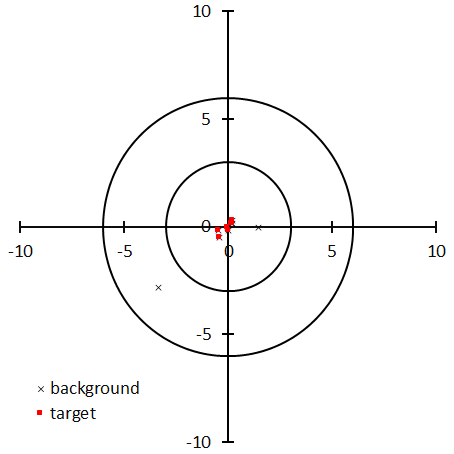
Figure 8 – Meteor showers listed in the IAUMDSD.
3 Summary of survey results
Tables 4 to 7 summarize the results for the 118 meteor showers investigated.
Table 4 gives the data that served as the starting point for the survey and the changes in the radiant point and geocentric velocity depending on the solar longitude. If you have these numbers and the original GMN data, you can reproduce the numbers from Table 5 onwards. Code represents the IAU numeral code + IAU 3 letter code + AdNo. The reason why Table 4 is not in the order of solar longitude is that it has been adjusted to the order of maximum solar longitude determined by the modeling shown in Table 7. λʘ, λ–λʘ and β are the values for radiant points listed in the IAUMDCSD, and the following investigation is conducted using these as the starting point. However, if they are not suitable as the origin, it will be changed and indicated in italics. Dr and Dλʘ are the scope of attribution judgment and investigation period The movement of the radiant point is approximated by a straight line on a coordinate system centered on this origin, with the direction in which the ecliptic longitude decreases along the ecliptic latitude line as the positive x-axis and the direction in which the ecliptic latitude increases along the ecliptic longitude line as the positive y-axis. Then, xa, xb, ya, and yb are the coefficients and constant terms of the approximate straight line. Similarly, va and vb are coefficients and constant terms that are linear approximations of the geocentric velocity. Please refer to the previous section for the specific examples of the Orionids, including the items in the table below.
Table 4 – Radiation points as the starting point of the survey, survey period, and the change in radiant point and geocentric velocity obtained by regression analysis.
| Code | Origin | Radiant shift | |||||||||||
| λʘ | λ–λʘ | b | Dr | Dλʘ | xa | xb | ya | yb | va | vb | |||
| 0647BCO00 | 13.3 | 175.25 | 29.14 | 3 | 10 | 0.1114 | –0.889 | 0.3953 | –4.1319 | –0.0341 | 27.0738 | ||
| 0040ZCY01 | 16 | 300.11 | 59.08 | 3 | 5 | –0.0665 | 0.8988 | –0.1696 | 2.6972 | 0.0498 | 42.6984 | ||
| 0841DHE00 | 19.5 | 232.08 | 46.26 | 3 | 5 | –0.0808 | 1.6894 | –0.1706 | 3.5906 | 0.0659 | 47.9721 | ||
| 0450AED00 | 20.2 | 292.83 | 29.85 | 3 | 5 | –0.0907 | 1.5561 | 0.2029 | –3.853 | –0.0931 | 62.4424 | ||
| 0839PSR00 | 25.1 | 211.69 | 34.29 | 3 | 5 | –0.3084 | 7.875 | –0.2934 | 7.6928 | 0.4016 | 35.135 | ||
| 0021AVB06 | 27.6 | 170.32 | 12.03 | 3 | 10 | 0.4675 | –12.7715 | 0.2377 | –6.2633 | –0.1712 | 23.9921 | ||
| 0040ZCY02 | 32 | 299.63 | 57.79 | 3 | 5 | 0.6056 | –18.7925 | 0.1266 | –3.6641 | –0.2587 | 49.9125 | ||
| 0006LYR00 | 32.2 | 241.39 | 56.72 | 3 | 5 | –0.3003 | 10.0005 | –0.3615 | 11.6821 | 0.2763 | 37.6836 | ||
| 0343HVI07 | 39.2 | 166.63 | –1.2 | 3 | 5 | 0.6749 | –25.9303 | –0.1702 | 6.4895 | –0.2917 | 29.7599 | ||
| 0348ARC01 | 42 | 311.73 | 56.56 | 3 | 5 | –0.6159 | 23.8141 | 0.0831 | –3.3468 | –0.2936 | 52.9007 | ||
| 0519BAQ00 | 46.3 | 278.91 | 13.47 | 3 | 5 | 0.0807 | –3.973 | –0.006 | 0.0891 | –0.0807 | 71.8886 | ||
| 0031ETA07 | 47 | 293.28 | 7.68 | 3 | 10 | 0.2451 | –11.5905 | 0.055 | –2.4999 | 0.0423 | 63.5525 | ||
| 0531GAQ01 | 49.8 | 262.44 | 32.44 | 3 | 5 | –0.1847 | 8.8321 | –0.0961 | 5.4252 | 0.0751 | 58.38 | ||
| 0854PCY00 | 53.8 | 276.79 | 71.98 | 3 | 10 | 0.2031 | –10.4586 | –0.0431 | 1.6777 | 0.0308 | 37.8613 | ||
| 0145ELY02 | 50 | 256.73 | 63.97 | 3 | 5 | 0.3748 | –18.641 | 0.0156 | –0.2332 | 0.025 | 42.6992 | ||
| 0520MBC00 | 56.8 | 244.94 | 4.28 | 3 | 10 | 0.2167 | –12.7955 | –0.036 | 2.5228 | –0.0625 | 69.136 | ||
| 0061TAH | 68 | 125 | 32 | 3 | 3 | 0.5295 | –37.0384 | 5.4157 | –371.208 | 0.326 | –11.2406 | ||
| 0860PAN00 | 71.6 | 307.92 | 43.24 | 2 | 3 | 0.275 | –19.1996 | 0.3804 | –27.0442 | –0.1867 | 63.8194 | ||
| 0362JMC01 | 71 | 324.61 | 43.4 | 3 | 10 | –0.1635 | 12.5697 | 0.3048 | –21.7102 | –0.1378 | 52.6056 | ||
| 0171ARI03 | 77 | 331.58 | 7.34 | 3 | 10 | 0.3638 | –27.9298 | –0.0141 | 1.5546 | 0.0781 | 34.5427 | ||
| 0458JEC00 | 82.3 | 248.13 | 47.78 | 3 | 3 | –0.4362 | 35.3057 | –0.2748 | 22.7932 | 0.1986 | 36.3117 | ||
| 0510JRC00 | 84 | 262.78 | 54.43 | 3 | 3 | 0.0372 | –2.7745 | –0.162 | 14.5395 | 0.0859 | 42.5144 | ||
| 0069SSG03 | 90 | 185.16 | –4.67 | 3 | 10 | 0.4559 | –41.1943 | 0.0322 | –4.6239 | –0.1244 | 36.0361 | ||
| 0170JBO07 | 89.64 | 102.98 | 59.03 | 3 | 3 | 1.3028 | –116.749 | 0.2386 | –21.1976 | 0.1806 | –2.3079 | ||
| 0410DPI00 | 92 | 280.17 | 0.75 | 3 | 5 | 0.2026 | –18.6893 | –0.0231 | 2.4041 | –0.0906 | 78.0196 | ||
| 0459JEO01 | 89 | 155.38 | 12.42 | 3 | 5 | 0.8038 | –71.308 | 0.3671 | –33.0682 | –0.1571 | 28.1574 | ||
| 0431JIP00 | 94.456 | 252.88 | 37.39 | 3 | 3 | –0.9655 | 91.2422 | –0.5911 | 56.0458 | –0.1943 | 76.8147 | ||
| 0867FPE00 | 96.7 | 254.6 | 16.38 | 3 | 3 | 0.155 | –15.1602 | 0.8084 | –77.8719 | –0.4798 | 112.6566 | ||
| 0372PPS_0 | 95 | 283.28 | 15.27 | 3 | 5 | 0.1076 | –10.275 | 0.1131 | –10.3518 | 0.01 | 65.3255 | ||
| 0164NZC03 | 101 | 209.69 | 12.71 | 3 | 15 | 0.108 | –10.6845 | 0.0367 | –3.9905 | –0.1068 | 49.682 | ||
| 0370MIC00 | 100 | 209.87 | –12.2 | 3 | 10 | 0.1416 | –13.3029 | –0.0707 | 9.0276 | –0.1032 | 50.488 | ||
| 1133TCS00 | 105.1 | 303.93 | 52.75 | 3 | 5 | –0.1759 | 18.5893 | 0.1755 | –18.4183 | –0.1716 | 64.2561 | ||
| 0411CAN00 | 105 | 298.06 | 33 | 3 | 10 | –0.052 | 5.3959 | 0.0934 | –10.0424 | –0.1091 | 68.5495 | ||
| 0175JPE02 | 110.9 | 244.09 | 14.49 | 3 | 10 | 0.1214 | –13.7635 | –0.1099 | 12.1921 | –0.0364 | 67.7813 | ||
| 0444ZCS00 | 113.2 | 277.79 | 42.82 | 3 | 3 | –0.3796 | 43.0291 | –0.3564 | 40.3444 | 0.1145 | 44.1326 | ||
| 0533JXA00 | 119 | 282.02 | –4.77 | 3 | 10 | 0.2315 | –27.8444 | 0.012 | –2.1535 | 0.0638 | 61.4211 | ||
| 0623XCS00 | 115 | 185 | 8 | 1.5 | 5 | 0.2066 | –24.1731 | 0.025 | –2.5507 | –0.0952 | 36.1377 | ||
| 0372PPS_1 | 120 | 278.96 | 15.98 | 3 | 5 | 0.2976 | –36.4379 | –0.4713 | 57.1145 | 0.1406 | 49.5335 | ||
| 0184GDR00 | 125.3 | 167.84 | 73.73 | 3 | 3 | 0.3917 | –49.0047 | 0.1612 | –20.5705 | –0.0961 | 39.6404 | ||
| 0001CAP06 | 126.1 | 179.64 | 9.72 | 3 | 5 | 0.3548 | –43.9871 | 0.1272 | –15.9994 | –0.1677 | 43.393 | ||
| 0005SDA00 | 127.2 | 208.56 | –7.44 | 3 | 5 | 0.2687 | –33.9557 | –0.1063 | 13.5181 | –0.1965 | 65.2986 | ||
| 0191ERI02 | 137 | 260.26 | –27.26 | 3 | 15 | –0.0024 | 0.5483 | 0.0019 | –0.4129 | 0.0015 | 63.9874 | ||
| 0465AXC00 | 135.8 | 252.41 | 41.99 | 3 | 3 | –0.8 | 108.6428 | –0.1896 | 26.2828 | 0.3021 | 14.5402 | ||
| 0007PER00 | 137 | 283.15 | 38.27 | 3 | 15 | –0.0406 | 5.5172 | –0.0661 | 9.335 | 0.0129 | 56.9855 | ||
| 0012KCG | 142 | 168 | 74 | 3 | 5 | –0.3753 | 54.7644 | 0.6381 | –93.1013 | 0.2353 | –10.8706 | ||
| 0199ADC01 | 143.1 | 180.04 | 2.33 | 3 | 3 | –0.0479 | 6.8369 | –0.2221 | 31.8215 | 0.2127 | –6.7381 | ||
| AXD | 145 | 142.5 | 77.47 | 3 | 5 | 0.2082 | –30.4049 | 1.0378 | –147.406 | 0.2001 | –7.6101 | ||
| 0026NDA10 | 144.8 | 207.24 | 6.81 | 3 | 10 | 0.0682 | –9.7592 | 0.0382 | –5.4769 | –0.1244 | 56.4329 | ||
| ZDR | 155 | 30.19 | 83.82 | 3 | 5 | –0.0627 | 7.5381 | –0.8019 | 124.0229 | –0.2273 | 56.7222 | ||
| 0523AGC00 | 155.1 | 263.11 | 63.51 | 3 | 5 | –0.1546 | 23.9816 | –0.0714 | 11.2097 | 0.0936 | 29.3975 | ||
| 0206AUR03 | 159 | 292.45 | 15.57 | 3 | 5 | 0.0855 | –13.6587 | 0.1356 | –21.2819 | –0.022 | 68.9463 | ||
| 0552PSO01 | 159 | 269.53 | –24.3 | 3 | 10 | –0.1719 | 29.5186 | –0.0368 | 5.9337 | –0.0001 | 65.5639 | ||
| 0694OMG00 | 164 | 307.13 | 16.76 | 3 | 10 | 0.1819 | –29.6546 | –0.0895 | 14.9512 | 0.1782 | 29.0183 | ||
| 0337NUE00 | 167.9 | 259.26 | –20.67 | 3 | 15 | 0.1213 | –19.9298 | 0.2203 | –37.1078 | 0.0517 | 56.8959 | ||
| 0208SPE02 | 168 | 248.97 | 20.79 | 3 | 5 | 0.0415 | –7.0712 | –0.2061 | 34.7059 | 0.036 | 58.0022 | ||
| 0215NPI04 | 176 | 196.75 | 3.87 | 3 | 15 | 0.1894 | –31.67 | –0.0021 | 0.3102 | –0.0687 | 40.1538 | ||
| 0081SLY00 | 169 | 294.7 | 32.27 | 3 | 5 | –0.1719 | 28.9685 | 0.2176 | –35.7013 | –0.183 | 89.7565 | ||
| 0757CCY00 | 171.64 | 142.43 | 51.4 | 3 | 5 | 0.6923 | –118.646 | 1.3672 | –235.88 | 0.0295 | 9.5829 | ||
| 0221DSX04 | 188 | 331.25 | –11.32 | 3 | 5 | 0.1299 | –23.8991 | –0.2572 | 48.3283 | –0.1272 | 56.3114 | ||
| 0081SLY01 | 186 | 278.78 | 25.99 | 3 | 5 | 0.1003 | –18.0282 | –0.1652 | 29.5384 | 0.1175 | 43.8318 | ||
| 0281OCT00 | 193 | 279.98 | 61.97 | 3 | 3 | 1.1864 | –229.216 | 0.1633 | –31.4408 | –0.9496 | 228.6515 | ||
| 0924SAN00 | 196.7 | 214.37 | 29.45 | 3 | 5 | –0.0063 | 1.188 | 0.1951 | –37.9924 | –0.0398 | 24.7732 | ||
| 0825XIE00 | 196.1 | 227.54 | –27.12 | 3 | 5 | –0.0183 | 3.0992 | –0.1149 | 22.0415 | –0.1092 | 75.846 | ||
| 0002STA_SE | 202.6 | 194.82 | –4.45 | 3 | 5 | 0.1977 | –40.8473 | –0.0345 | 7.0159 | –0.0968 | 48.2632 | ||
| 0333OCU00 | 202.1 | 278.86 | 46.82 | 3 | 5 | –0.571 | 115.4577 | –0.0059 | 1.1627 | –0.0587 | 67.3791 | ||
| 0023EGE00 | 209.7 | 253.48 | 4.2 | 3 | 10 | 0.2135 | –44.9085 | –0.0613 | 13.3966 | –0.0354 | 75.9489 | ||
| 0022LMI03 | 209 | 297.96 | 25.93 | 3 | 5 | –0.023 | 4.7739 | 0.1067 | –22.0377 | –0.0724 | 76.4444 | ||
| 0480TCA_OML | 210.5 | 283.37 | 13.63 | 3 | 15 | 0.2173 | –45.5829 | 0.2711 | –56.9822 | 0.0046 | 66.0806 | ||
| 0008ORI00 | 208.7 | 246.56 | –7.45 | 3 | 10 | 0.2418 | –50.662 | 0.0682 | –14.3876 | –0.0714 | 80.5061 | ||
| 0524LUM00 | 215 | 284.08 | 36.9 | 3 | 5 | –0.0562 | 11.8263 | –0.2106 | 45.0985 | 0.0133 | 57.6923 | ||
| 0526SLD00 | 221.6 | 265.65 | 53.89 | 3 | 3 | –0.2732 | 60.7616 | –0.51 | 112.5384 | 0.3182 | –21.5505 | ||
| 0002STA_SF | 221.5 | 190.7 | –5 | 2 | 5 | 0.4893 | –110.27 | –0.0676 | 15.4866 | –0.3282 | 101.4279 | ||
| 0445KUM00 | 225 | 268.21 | 29.76 | 3 | 5 | 0.011 | –2.2506 | –0.1798 | 40.0375 | 0.0387 | 56.2142 | ||
| 0338OER_DGE | 225 | 186.62 | –18.2 | 6 | 25 | 0.3021 | –67.8047 | –0.2913 | 64.4547 | –0.1381 | 59.5427 | ||
| 0018AND01 | 228.6 | 163.43 | 18.81 | 3 | 15 | 0.4525 | –103.95 | 0.583 | –131.503 | –0.129 | 47.1005 | ||
| 0512RPU00 | 223 | 266 | –43.46 | 3 | 10 | –0.2728 | 59.1409 | 0.2348 | –53.2242 | 0.1975 | 12.7893 | ||
| 0017NTA03 | 222.7 | 192.77 | 2.85 | 3 | 20 | 0.2493 | –55.8429 | 0.0068 | –1.9411 | –0.125 | 56.6041 | ||
| 0013LEO00 | 235.2 | 271.83 | 10.22 | 3 | 10 | 0.3128 | –74.3409 | –0.1568 | 37.014 | 0.0475 | 58.5456 | ||
| 0394ACA00 | 247 | 215.81 | –40.29 | 3 | 10 | –0.0376 | 8.2361 | 0.3104 | –75.8768 | 0.1184 | 15.3703 | ||
| 0246AMO00 | 239 | 239.65 | –19.91 | 2 | 5 | 0.0288 | –6.7519 | 0.0655 | –15.7132 | –0.1309 | 93.095 | ||
| 0488NSU00 | 241.6 | 244.91 | 42.93 | 3 | 3 | –0.4783 | 115.4909 | –0.3742 | 90.7317 | 0.5148 | –70.0019 | ||
| 0250NOO06 | 247 | 203.59 | –8.24 | 3 | 10 | 0.3154 | –78.0349 | –0.0617 | 15.4998 | –0.154 | 80.7632 | ||
| 0257ORS03 | 243 | 190.78 | –4.69 | 3 | 5 | 0.1671 | –40.4572 | 0.0213 | –5.2689 | –0.0716 | 45.0609 | ||
| 1096NAC00 | 246.2 | 285.89 | –19.99 | 3 | 5 | 0.0303 | –7.8055 | 0.1777 | –44.3511 | 0.1128 | 38.8415 | ||
| 0340TPY00 | 249.4 | 261.96 | –39.09 | 3 | 3 | –0.2619 | 65.8754 | 0.3503 | –87.6017 | 0.3206 | –19.856 | ||
| 0336DKD01 | 252 | 243.06 | 61.66 | 3 | 5 | –0.3642 | 91.4251 | 0.0718 | –18.1264 | 0.068 | 26.7305 | ||
| 0339PSU01 | 253 | 258.89 | 34.52 | 3 | 10 | –0.1293 | 33.2236 | –0.1445 | 37.3849 | 0.1253 | 29.367 | ||
| 0334DAD00 | 256.5 | 266.12 | 62.96 | 3 | 15 | –0.3261 | 83.5243 | 0.0121 | –3.3008 | 0.0057 | 39.1135 | ||
| 0016HYD01 | 259.1 | 229.92 | –16.76 | 3 | 20 | 0.1092 | –28.8909 | –0.0107 | 2.9956 | –0.07 | 76.6474 | ||
| 0502DRV00 | 252.5 | 286.95 | 13.84 | 3 | 10 | 0.1498 | –37.4094 | 0.2763 | –69.4976 | 0.0398 | 58.0096 | ||
| 0529EHY00 | 260.7 | 237.33 | –14.7 | 3 | 20 | 0.12 | –31.1678 | 0.0405 | –10.472 | –0.042 | 72.8472 | ||
| 0255PUV00 | 254 | 258.16 | –60.51 | 3 | 10 | –0.3877 | 94.6079 | –0.1294 | 31.7667 | –0.0332 | 50.1627 | ||
| 0019MON01 | 261.5 | 202.13 | –14.81 | 3 | 15 | 0.3146 | –81.5491 | –0.0659 | 17.0315 | –0.173 | 86.0296 | ||
| 0004GEM00 | 261.6 | 207.94 | 10.4 | 3 | 10 | 0.1016 | –26.6594 | –0.0462 | 12.2033 | 0.1051 | 6.3179 | ||
| 0335XVI00 | 256.7 | 292.67 | –4.56 | 3 | 15 | 0.247 | –63.8677 | –0.0526 | 13.2224 | 0.072 | 49.1877 | ||
| 0497DAB00 | 263.9 | 298.47 | 33.45 | 3 | 5 | –0.0514 | 13.8764 | 0.3223 | –85.6914 | –0.1539 | 99.9159 | ||
| 0340TPY01 | 264 | 259.58 | –33.53 | 3 | 5 | –0.0569 | 15.0139 | 0.3278 | –85.9806 | 0.2346 | 1.0001 | ||
| 0020COM03 | 275.9 | 242.79 | 20.53 | 3 | 30 | 0.0465 | –12.5646 | –0.0698 | 19.2142 | –0.0055 | 64.2899 | ||
| 0015URS01 | 271 | 218.48 | 72.07 | 3 | 5 | 0.0334 | –9.1414 | 0.5758 | –155.805 | –0.2288 | 94.9921 | ||
| 0428DSV00 | 267.41 | 293.72 | 14.78 | 3 | 30 | 0.1307 | –35.1538 | 0.1089 | –29.3136 | 0.0201 | 60.6018 | ||
| 0784KVE00 | 276 | 257.77 | –60.48 | 3 | 5 | –0.6225 | 170.2818 | 0.1063 | –28.3692 | 0.2457 | –24.2441 | ||
| 0319JLE00 | 282.5 | 219.77 | 10.41 | 3 | 5 | 0.3376 | –94.8099 | 0.0608 | –17.3523 | –0.4394 | 175.6707 | ||
| 0010QUA00 | 283.28 | 276.97 | 63.58 | 3 | 10 | 0.1717 | –48.5025 | 0.2691 | –76.0478 | –0.2153 | 101.4334 | ||
| 0331AHY00 | 285.5 | 206.75 | –25.99 | 3 | 10 | 0.2751 | –79.1128 | –0.0453 | 12.6156 | –0.1425 | 84.0134 | ||
| 0515OLE00 | 290 | 207.98 | –6.91 | 3 | 5 | 0.2457 | –72.0572 | –0.2923 | 83.8488 | –0.1049 | 76.771 | ||
| 0323XCB04 | 296 | 306.92 | 51.36 | 3 | 5 | 0.1063 | –31.595 | 0.1704 | –50.7995 | –0.0667 | 65.0871 | ||
| 0341XUM06 | 298.4 | 218.3 | 25.85 | 3 | 5 | 0.4109 | –122.504 | –0.3088 | 92.1558 | 0.1963 | –17.6211 | ||
| 0404GUM04 | 299.7 | 217.38 | 74.32 | 3 | 5 | –0.6969 | 208.5355 | 0.1979 | –59.1513 | 0.2712 | –51.9283 | ||
| 0429ACB00 | 309.89 | 271.81 | 44.48 | 3 | 5 | –0.521 | 160.507 | –0.6344 | 195.3062 | 0.3573 | –52.7269 | ||
| 0110AAN04 | 312 | 210.6 | –17.67 | 3 | 10 | 0.054 | –17.2448 | –0.0392 | 12.517 | –0.0408 | 56.6646 | ||
| 0427FED00 | 315.1 | 228.34 | 76.59 | 3 | 5 | 0.6447 | –203.526 | –0.0605 | 18.4312 | –0.2357 | 109.3789 | ||
| 1032FHY00 | 324.3 | 161.57 | –17.83 | 3 | 5 | 0.3352 | –108.279 | –0.6002 | 194.2505 | –0.0559 | 34.306 | ||
| 1166TTR00 | 331.9 | 285.23 | –44.22 | 3 | 5 | –0.6675 | 221.5964 | 0.2326 | –76.9744 | –0.0972 | 88.6073 | ||
| 0915DNO00 | 333.7 | 271.99 | –24.95 | 3 | 5 | 0.1423 | –47.1462 | 0.0408 | –13.5988 | –0.0791 | 93.1613 | ||
| 0571TSB00 | 344 | 221.78 | 36.5 | 3 | 5 | 0.8277 | –283.702 | 0.225 | –77.0865 | –0.5564 | 240.642 | ||
| 0346XHE01 | 350 | 244.94 | 70.58 | 3 | 5 | –0.7215 | 252.5716 | –0.0416 | 14.8965 | 0.0511 | 16.4979 | ||
| 0011EVI06 | 357.2 | 186.68 | 5.39 | 3 | 10 | 0.2417 | –86.8488 | 0.0442 | –15.9647 | –0.1314 | 74.294 | ||
| 0893EOP00 | 358 | 262.63 | 6.72 | 3 | 10 | 0.2195 | –78.7953 | –0.0268 | 9.5359 | –0.0295 | 81.3416 | ||
Table 5 provides an overview of the radiant distribution and activity profile. The radiant density shows the coefficients a and b when the radiant point distribution density corrected for the radiant shift is approximated by an exponential function N = a*rb of the distance r (degrees) from the center. The columns from Nr < =3 to DR3_20 show the solar longitude at the maximum and the maximum value using five different methods. The activity of a meteor shower is expressed by an increase or decrease in the number of meteors classified as shower members. Most of the attributed meteors are within 3 degrees of the estimated position in many meteor showers. Nr< = 3 indicates the maximum solar longitude and its maximum value for meteors within 3 degrees from the estimated radiant. In many cases, this is sufficient, but in some cases, there is a bias in the observation itself, so correction is necessary. In this paper, the correction is made by taking the ratio of the number of meteors within 3 degrees from the center and the number of surrounding meteors. The items following DR3_6 are based on the ratio of the number of meteors within 3 degrees to the number of surrounding meteors per unit area (square degree). DR3_6 uses meteors at 3 to 6 degrees from the center, DR3_10 at 6 to 10 degrees, DR3_15 at 10 to 15 degrees, and DR3_20 at 15 to 20 degrees for comparison. It is necessary to use these values depending on the activity of the surrounding meteor shower. The values shown in Table 5 are based on a moving average of 3 degrees in solar ecliptic longitude.
Table 5 – Radiant distribution and activity profile.
| Code | Radiant density | Nr< = 3 | DR3_6 | DR3_10 | DR3_15 | DR3_20 | ||||||
| a | b | λʘ | max | λʘ | max | λʘ | max | λʘ | max | λʘ | max | |
| BCO | 5.66 | –0.875 | 14.5 | 12 | 13.5 | 5.6 | 14.5 | 8 | 15.5 | 8.5 | 15.5 | 5.9 |
| ZCY_0 | 5.83 | –0.746 | 18.5 | 20 | 15.5 | 2.2 | 14.5 | 5.4 | 12.5 | 8.5 | 19.5 | 9.3 |
| DHE | 3.97 | –1.137 | 19.5 | 23 | 19.5 | 8.1 | 19.5 | 11.7 | 19.5 | 9.4 | 20.5 | 5.3 |
| AED | 1.96 | –1.552 | 17.5 | 22 | 23.5 | 13.5 | 21.5 | 12 | 18.5 | 13.3 | 18.5 | 12.3 |
| PSR | 4.12 | –1.112 | 25.5 | 27 | 25.5 | 5.5 | 24.5 | 10 | 24.5 | 19.5 | 24.5 | 13.5 |
| AVB | 14.49 | –1.052 | 17.5 | 27 | 23.5 | 6.5 | 28.5 | 9.1 | 23.5 | 8.7 | 28.5 | 8.4 |
| ZCY_1 | 6.09 | –0.669 | 32.5 | 20 | 29.5 | 1.5 | 32.5 | 4.3 | 32.5 | 7.5 | 32.5 | 11.2 |
| LYR | 122.8 | –2.177 | 32.5 | 1326 | 33.5 | 31.9 | 32.5 | 184.7 | 32.5 | 214.4 | 32.5 | 314.8 |
| HVI | 8.93 | –1.232 | 39.5 | 43 | 38.5 | 10.2 | 39.5 | 11.5 | 39.5 | 15.5 | 39.5 | 15.1 |
| ARC | 4.52 | –1.035 | 40.5 | 17 | 46.5 | 6 | 41.5 | 13.1 | 41.5 | 14.2 | 40.5 | 12.8 |
| BAQ | 4.18 | –1.151 | 43.5 | 14 | 42.5 | 9.3 | 42.5 | 9.9 | 41.5 | 3.9 | 50.5 | 1.2 |
| ETA | 148.56 | –2.66 | 44.5 | 612 | 45.5 | 85.8 | 48.5 | 400.1 | 43.5 | 636.8 | 45.5 | 605 |
| GAQ | 3.93 | –0.773 | 48.5 | 18 | 48.5 | 6.3 | 47.5 | 4.3 | 47.5 | 5.1 | 47.5 | 6.6 |
| PCY | 6.6 | –0.68 | 50.5 | 14 | 46.5 | 4.7 | 55.5 | 7.6 | 54.5 | 9.2 | 54.5 | 6.6 |
| ELY | 14.88 | –1.36 | 50.5 | 142 | 51.5 | 15.8 | 50.5 | 30.5 | 50.5 | 32.8 | 50.5 | 50.1 |
| MBC | 4.58 | –0.945 | 59.5 | 12 | 56.5 | 7.7 | 54.5 | 8.1 | 53.5 | 9.3 | 58.5 | 7.5 |
| TAH | 51.98 | –2.375 | 69.5 | 1105 | 70.5 | 30.6 | 69.5 | 439.8 | 69.5 | 657.6 | 68.5 | 653.9 |
| PAN | 3.59 | –1.219 | 71.5 | 22 | 72.5 | 31.5 | 72.5 | 10.3 | 72.5 | 9.5 | 71.5 | 10 |
| JMC | 5.48 | –1.118 | 70.5 | 12 | 77.5 | 5.6 | 75.5 | 19.5 | 67.5 | 28.9 | 75.5 | 22.2 |
| ARI | 6.15 | –1.562 | 80.9 | 25 | 80.3 | 56.9 | 81.3 | 148.9 | 80.7 | 316.9 | 78.1 | 325.4 |
| JEC | 7.86 | –1.371 | 82.5 | 102 | 83.5 | 11.5 | 81.5 | 15.9 | 81.5 | 12.8 | 83.5 | 18 |
| JRC | 5.12 | –1.067 | 83.5 | 46 | 84.5 | 6.7 | 84.5 | 11.2 | 84.5 | 11.6 | 84.5 | 15.1 |
| SSG | 11.33 | –0.851 | 82.5 | 20 | 83.5 | 5.2 | 89.5 | 5.9 | 89.5 | 6.2 | 88.5 | 9.1 |
| JBO | 2.85 | –1.132 | 90.5 | 18 | 91.5 | 9.5 | 89.5 | 10.6 | 89.5 | 14.2 | 89.5 | 11.5 |
| DPI | 5.11 | –1.22 | 91.5 | 26 | 91.5 | 14.7 | 90.5 | 10.7 | 90.5 | 6.2 | 90.5 | 9.5 |
| JEO | 4.65 | –1.259 | 92.5 | 20 | 93.5 | 12.7 | 91.5 | 23.3 | 92.5 | 19.4 | 92.5 | 10.4 |
| JIP | 5.82 | –1.257 | 94.5 | 63 | 93.5 | 15.7 | 93.5 | 13.8 | 93.5 | 11.7 | 93.5 | 10.2 |
| FPE | 3.51 | –0.919 | 96.5 | 21 | 95.5 | 4.1 | 95.5 | 5.4 | 95.5 | 6.1 | 95.5 | 6.7 |
| PPS_0 | 17.26 | –1.381 | 98.5 | 48 | 93.5 | 8.4 | 94.5 | 17.7 | 94.5 | 18.6 | 91.5 | 16.7 |
| NZC | 50.43 | –1.454 | 107.5 | 72 | 110.5 | 8.9 | 110.5 | 30.3 | 102.5 | 34 | 102.5 | 34.8 |
| MIC | 10.78 | –1.296 | 101.5 | 29 | 108.5 | 12.2 | 101.5 | 29.7 | 102.5 | 21.2 | 101.5 | 14.7 |
| TCS | 3.82 | –0.909 | 105.5 | 14 | 102.5 | 3.5 | 104.5 | 6.1 | 104.5 | 7.3 | 104.5 | 2.7 |
| CAN | 25.86 | –1.141 | 106.5 | 64 | 103.5 | 9.9 | 109.5 | 14.7 | 98.5 | 15.5 | 105.5 | 14.3 |
| JPE | 26.85 | –1.355 | 108.5 | 80 | 109.5 | 16.4 | 109.5 | 17.2 | 109.5 | 26.3 | 109.5 | 25.5 |
| ZCS | 23.01 | –1.539 | 113.5 | 166 | 113.5 | 19.3 | 112.5 | 24.7 | 113.5 | 30.4 | 113.5 | 29.6 |
| JXA | 7.77 | –1.166 | 116.5 | 17 | 111.5 | 11 | 110.5 | 17.7 | 119.5 | 14.7 | 110.5 | 7.3 |
| XCS | 25.3 | –1.374 | 117.5 | 81 | 116.5 | 6.3 | 118.5 | 15.7 | 118.5 | 21.8 | 117.5 | 31.5 |
| PPS_1 | 8.99 | –0.713 | 115.5 | 38 | 122.5 | 3.3 | 114.5 | 5.2 | 115.5 | 6.3 | 114.5 | 5.9 |
| GDR | 16.19 | –1.706 | 125.5 | 185 | 125.5 | 23.3 | 125.5 | 40 | 125.5 | 46.8 | 125.5 | 46.2 |
| CAP | 91.85 | –2.066 | 127.5 | 354 | 126.5 | 25.5 | 125.5 | 75 | 127.5 | 94.5 | 127.5 | 122.8 |
| SDA | 242.13 | –2.408 | 126.5 | 996 | 126.5 | 32.6 | 127.5 | 187.9 | 126.5 | 250.2 | 126.5 | 357.8 |
| ERI | 33.73 | –1.184 | 132.5 | 53 | 135.5 | 11.8 | 131.5 | 19.5 | 131.5 | 33.3 | 139.5 | 29.4 |
| AXC | 5.61 | –0.907 | 135.5 | 41 | 135.5 | 7.2 | 136.5 | 5.9 | 135.5 | 6.7 | 135.5 | 5.4 |
| PER | 1586.13 | –2.298 | 140.5 | 6711 | 140.5 | 36.3 | 140.5 | 561.6 | 140.5 | 1102.7 | 140.5 | 1169.8 |
| KCG | 37.71 | –1.22 | 141.5 | 105 | 142.5 | 5.6 | 139.5 | 11.8 | 140.5 | 29.5 | 140.5 | 36.9 |
| ADC | 8.04 | –1.193 | 143.5 | 138 | 142.5 | 9.1 | 144.5 | 11.5 | 144.5 | 16 | 142.5 | 17.6 |
| AXD | 11.96 | –0.424 | 146.5 | 41 | 147.5 | 2.7 | 148.5 | 3.7 | 144.5 | 7 | 146.5 | 15.5 |
| NDA | 47.32 | –1.128 | 152.5 | 73 | 152.5 | 5.3 | 140.5 | 15.3 | 144.5 | 12.5 | 150.5 | 15 |
| ZDR | 8.87 | –0.705 | 153.5 | 33 | 156.5 | 3.2 | 154.5 | 5.4 | 154.5 | 6 | 149.5 | 7.8 |
| AGC | 10.92 | –0.87 | 156.5 | 48 | 157.5 | 4.7 | 155.5 | 9.4 | 155.5 | 8.6 | 155.5 | 8.4 |
| AUR | 16.35 | –1.232 | 158.5 | 74 | 157.5 | 7.4 | 159.5 | 9.5 | 157.5 | 8.2 | 158.5 | 8.2 |
| PSO | 16.01 | –0.462 | 160.5 | 43 | 164.5 | 2.3 | 160.5 | 3.4 | 160.5 | 7.5 | 160.5 | 9.5 |
| OMG | 10.22 | –1.01 | 163.5 | 24 | 169.5 | 6 | 162.5 | 11.5 | 164.5 | 5.7 | 164.5 | 6.7 |
| NUE | 35.48 | –0.625 | 164.5 | 46 | 174.5 | 2.9 | 164.5 | 4.4 | 166.5 | 7.2 | 164.5 | 9.3 |
| SPE | 42.26 | –1.514 | 166.5 | 235 | 166.5 | 21.9 | 166.5 | 29.8 | 166.5 | 34.1 | 166.5 | 37.2 |
| NPI | 46.66 | –0.577 | 163.5 | 51 | 165.5 | 3.3 | 165.5 | 4.1 | 167.5 | 6.5 | 167.5 | 13.3 |
| SLY_0 | 12.96 | –1.159 | 169.5 | 48 | 168.5 | 8.6 | 169.5 | 11.6 | 168.5 | 10.1 | 169.5 | 11.1 |
| CCY | 11.23 | –1.386 | 173.5 | 41 | 172.5 | 7.3 | 171.5 | 18.3 | 172.5 | 23 | 172.5 | 19.5 |
| DSX | 3.99 | –1.399 | 188.5 | 13 | 192.5 | 36 | 186.5 | 134.7 | 190.5 | 179.1 | 188.5 | 111.7 |
| SLY_1 | 9.83 | –0.606 | 189.5 | 37 | 190.5 | 3.2 | 190.5 | 3.9 | 185.5 | 5.3 | 185.5 | 4.9 |
| OCT | 10.52 | –1.411 | 192.5 | 223 | 192.5 | 14.3 | 193.5 | 20.1 | 192.5 | 21.9 | 193.5 | 20.7 |
| SAN | 2.48 | –1.147 | 197.5 | 14 | 196.5 | 3.7 | 197.5 | 6.7 | 196.5 | 6.3 | 197.5 | 4.7 |
| XIE | 3.5 | –0.982 | 195.5 | 11 | 197.5 | 10.7 | 195.5 | 6.6 | 195.5 | 5.5 | 197.5 | 5.6 |
| STA_SE | 111.61 | –1.393 | 204.5 | 301 | 203.5 | 9.5 | 200.5 | 17.5 | 201.5 | 41.8 | 206.5 | 70.1 |
| OCU | 16.46 | –1.291 | 202.5 | 158 | 202.5 | 15.9 | 202.5 | 30.6 | 202.5 | 32 | 202.5 | 21.3 |
| EGE | 36.12 | –0.97 | 208.5 | 61 | 212.5 | 6 | 207.5 | 6.8 | 199.5 | 2.7 | 212.5 | 3 |
| LMI | 28.61 | –1.909 | 208.5 | 126 | 210.5 | 28.9 | 210.5 | 61.4 | 207.5 | 53.8 | 209.5 | 29.9 |
| TCA | 33.21 | –0.901 | 211.5 | 38 | 196.5 | 7.4 | 208.5 | 8.1 | 210.5 | 7.7 | 202.5 | 4.9 |
| ORI | 803.97 | –2.312 | 208.5 | 2436 | 208.5 | 43.1 | 208.5 | 227.9 | 208.5 | 222.8 | 210.5 | 331.8 |
| LUM | 8.98 | –1.106 | 214.5 | 45 | 215.5 | 9.4 | 214.5 | 12.8 | 214.5 | 9.8 | 214.5 | 6.4 |
| SLD | 7.96 | –1.06 | 221.5 | 77 | 222.5 | 6.2 | 221.5 | 7.1 | 221.5 | 6.9 | 221.5 | 9.8 |
| STA_SF | 211.97 | –1.438 | 219.5 | 608 | 223.5 | 11.7 | 217.5 | 12.6 | 219.5 | 55.9 | 218.5 | 95.5 |
| KUM | 19.35 | –1.158 | 222.5 | 155 | 223.5 | 10.8 | 223.5 | 10.8 | 223.5 | 11.3 | 223.5 | 10.6 |
| OER | 38.74 | –0.778 | 217.5 | 36 | 246.5 | 4.7 | 235.5 | 11.8 | 247.5 | 9.1 | 247.5 | 3.2 |
| AND | 45.03 | –1.313 | 239.5 | 103 | 239.5 | 20 | 239.5 | 41.3 | 243.5 | 39.9 | 240.5 | 43.5 |
| RPU | 5.75 | –0.933 | 222.5 | 13 | 218.5 | 6.7 | 223.5 | 7.8 | 225.5 | 8.4 | 227.5 | 6.7 |
| NTA | 405.55 | –1.474 | 222.5 | 420 | 229.5 | 18.9 | 228.5 | 10.7 | 225.5 | 48.2 | 224.5 | 90.9 |
| LEO | 155.21 | –1.96 | 236.5 | 479 | 235.5 | 40.5 | 235.5 | 110 | 236.5 | 98.4 | 236.5 | 93 |
| ACA | 5.64 | –0.976 | 243.5 | 17 | 238.5 | 4.3 | 242.5 | 10.2 | 239.5 | 12.8 | 238.5 | 12.8 |
| AMO | 9.78 | –0.851 | 239.5 | 58 | 239.5 | 5.5 | 239.5 | 6.4 | 239.5 | 7.2 | 239.5 | 8.5 |
| NSU | 5.18 | –0.903 | 241.5 | 29 | 241.5 | 4.5 | 241.5 | 5.4 | 241.5 | 5.3 | 242.5 | 4.1 |
| NOO | 120.81 | –1.509 | 248.5 | 257 | 246.5 | 18.3 | 246.5 | 33.8 | 247.5 | 26.2 | 246.5 | 20 |
| ORS | 32.29 | –1.018 | 247.5 | 82 | 246.5 | 4.4 | 247.5 | 2.4 | 238.5 | 5.2 | 247.5 | 10.8 |
| NAC | 4.04 | –0.807 | 246.5 | 18 | 245.5 | 5 | 247.5 | 4.9 | 245.5 | 6.1 | 245.5 | 5.6 |
| TPY_0 | 5.98 | –1.258 | 249.5 | 25 | 249.5 | 5.7 | 249.5 | 8.8 | 249.5 | 12.4 | 249.5 | 8.8 |
| DKD | 24.5 | –1.183 | 250.5 | 144 | 251.5 | 8 | 251.5 | 19.4 | 250.5 | 33.8 | 251.5 | 45.3 |
| PSU | 17.84 | –0.854 | 251.5 | 42 | 252.5 | 7.7 | 251.5 | 10 | 251.5 | 9.8 | 251.5 | 8 |
| DAD | 25.92 | –0.535 | 243.5 | 36 | 243.5 | 3.2 | 242.5 | 6.2 | 256.5 | 8.5 | 257.5 | 13.3 |
| HYD | 200.53 | –1.668 | 254.5 | 356 | 250.5 | 37.9 | 250.5 | 56.9 | 255.5 | 111.5 | 255.5 | 122.1 |
| DRV | 11.12 | –0.793 | 253.5 | 23 | 252.5 | 6.3 | 252.5 | 4.4 | 254.5 | 7.2 | 258.5 | 6.7 |
| EHY | 42.56 | –1.021 | 263.5 | 40 | 271.5 | 3.1 | 272.5 | 2.7 | 255.5 | 9.8 | 256.5 | 17.5 |
| PUV | 14.72 | –1.33 | 259.5 | 22 | 249.5 | 6.3 | 256.5 | 18 | 253.5 | 33.2 | 260.5 | 44.7 |
| MON | 85.89 | –1.291 | 258.5 | 149 | 258.5 | 21.3 | 259.5 | 30.8 | 255.5 | 57.1 | 258.5 | 38.3 |
| GEM | 1479.18 | –2.934 | 262.5 | 13471 | 263.5 | 73.9 | 261.5 | 1139.6 | 261.5 | 4129 | 261.5 | 2326.3 |
| XVI | 16.3 | –1.407 | 261.5 | 25 | 255.5 | 24.5 | 262.5 | 20.1 | 256.5 | 17.8 | 257.5 | 8.3 |
| DAB | 5.15 | –1.299 | 263.5 | 27 | 261.5 | 26.2 | 263.5 | 14.4 | 263.5 | 16.8 | 263.5 | 6 |
| TPY_1 | 5.05 | –0.975 | 265.5 | 19 | 263.5 | 7.6 | 264.5 | 5.8 | 264.5 | 5.5 | 264.5 | 6 |
| COM | 198.34 | –1.533 | 264.5 | 221 | 270.5 | 25.4 | 266.5 | 38.1 | 265.5 | 33.4 | 267.5 | 56.2 |
| URS | 38.25 | –1.834 | 270.5 | 590 | 269.5 | 24.6 | 270.5 | 88.5 | 269.5 | 109.7 | 269.5 | 119.6 |
| DSV | 46.64 | –1.133 | 274.5 | 33 | 269.5 | 11.2 | 274.5 | 12.3 | 273.5 | 13.5 | 270.5 | 19.4 |
| KVE | 4.56 | –1.053 | 276.5 | 19 | 277.5 | 4.2 | 275.5 | 9.6 | 274.5 | 20.4 | 277.5 | 16.4 |
| JLE | 3.57 | –0.985 | 281.5 | 13 | 282.5 | 13.2 | 282.5 | 4.6 | 280.5 | 3.4 | 280.5 | 3 |
| QUA | 156.55 | –1.495 | 283.5 | 1689 | 283.5 | 12.4 | 283.5 | 94.2 | 282.5 | 271.8 | 282.5 | 380.1 |
| AHY | 19.69 | –1.632 | 284.5 | 37 | 284.5 | 12.2 | 287.5 | 51.7 | 286.5 | 44.3 | 284.5 | 23.6 |
| OLE | 7.75 | –1.013 | 288.5 | 32 | 288.5 | 5.8 | 288.5 | 13.4 | 288.5 | 9.9 | 288.5 | 6.7 |
| XCB | 6.36 | –1.277 | 296.5 | 28 | 297.5 | 11.4 | 296.5 | 30.9 | 296.5 | 17.2 | 296.5 | 15.6 |
| XUM | 11.72 | –1.596 | 298.5 | 90 | 298.5 | 21.1 | 298.5 | 65 | 298.5 | 24.6 | 298.5 | 22.9 |
| GUM | 11.2 | –1.292 | 300.5 | 72 | 298.5 | 12 | 300.5 | 16.3 | 299.5 | 17.7 | 299.5 | 17.8 |
| ACB | 12.33 | –1.07 | 307.5 | 109 | 308.5 | 12.3 | 307.5 | 10.2 | 308.5 | 10.9 | 308.5 | 13 |
| AAN | 7.28 | –1.079 | 311.5 | 17 | 314.5 | 13.7 | 313.5 | 14.2 | 312.5 | 5.9 | 314.5 | 7.6 |
| FED | 3.49 | –0.724 | 315.5 | 26 | 315.5 | 6.7 | 314.5 | 7.6 | 314.5 | 9.9 | 314.5 | 8.6 |
| FHY | 3.9 | –1.042 | 324.5 | 14 | 325.5 | 7.7 | 325.5 | 6.5 | 325.5 | 6.1 | 326.5 | 5.8 |
| TTR | 2.41 | –1.023 | 331.5 | 11 | 335.5 | 18 | 333.5 | 11.3 | 328.5 | 6.7 | 332.5 | 8.9 |
| DNO | 3.1 | –0.991 | 334.5 | 13 | 335.5 | 13.5 | 338.5 | 9.5 | 333.5 | 7.1 | 333.5 | 6.8 |
| TSB | 3.46 | –0.913 | 343.5 | 13 | 342.5 | 4.4 | 344.5 | 9.1 | 344.5 | 6.6 | 344.5 | 6.4 |
| XHE | 5.02 | –0.942 | 350.5 | 26 | 351.5 | 9.9 | 351.5 | 8.7 | 351.5 | 8.5 | 351.5 | 12.4 |
| EVI | 16.98 | –0.967 | 358.5 | 57 | 359.5 | 7.9 | 358.5 | 7.5 | 358.5 | 13.3 | 359.5 | 20.3 |
| EOP | 3.22 | –0.997 | 363.5 | 11 | 358.5 | 12 | 355.5 | 11.3 | 356.5 | 7 | 356.5 | 6.5 |
Table 6 shows an overview of meteor shower activity. “Meteors per year” shows the number of meteors that fall within 3 degrees of the estimated position of the radiant in each year during the survey period shown in Table 4. The number of meteors in many meteor showers appears to increase each year because the number of GMN observations increases almost exponentially. However, it should be noted that 2019 is the year when observations began, so there are large variations, and 2023 uses data up to February, so there are many cases that are displayed as 0. The next six items are related to the activity profile. “Profile” is the observation curve that was used as the basis for drawing the estimated profile. Those using lowercase letters are moving averages every third degree, and those using uppercase letters are moving averages every one degree. C1 and C2 represent the spread of activity, and C3 represents the maximum sharpness. λʘ and max are estimated values based on the estimated profile and indicate the maximum solar longitude and maximum value. The values below the decimal point for the maximum solar ecliptic longitude are obtained from the graph and are for reference only. This estimated curve is shown in part III, “Radiant point distribution map and activity profile” along with the activity curve shown in the “Profile” column.
Table 6 – Annual changes in the number of shower meteors and indices of the modelled activity profile.
| Code | Meteors per year | Indices of the modelled activity profile | |||||||||
| 2019 | 2020 | 2021 | 2022 | 2023 | Profile | C1 | C2 | C3 | λʘ | max | |
| BCO | 7 | 22 | 43 | 68 | 0 | dr3_15 | 10 | 10 | 2 | 13 | 8 |
| ZCY_0 | 3 | 20 | 39 | 72 | 0 | dr3_15 | 5 | 5 | 3 | 16 | 10 |
| DHE | 0 | 5 | 16 | 46 | 0 | DR3_15 | 45 | 45 | 2 | 19.6 | 19 |
| AED | 3 | 24 | 36 | 58 | 0 | dr3_15 | 16 | 16 | 2 | 20 | 15 |
| PSR | 1 | 10 | 27 | 26 | 0 | DR3_15 | 45 | 45 | 2 | 24.7 | 29 |
| AVB | 7 | 89 | 101 | 112 | 0 | dr3_15 | 15 | 15 | 2 | 25 | 8 |
| ZCY_1 | 4 | 24 | 40 | 55 | 0 | dr3_15 | 8 | 8 | 2 | 31.5 | 8 |
| LYR | 40 | 599 | 863 | 1216 | 0 | DR3_15 | 35 | 35 | 1.5 | 32.3 | 402 |
| HVI | 15 | 166 | 11 | 10 | 0 | dr3_15 | 110 | 110 | 1.7 | 39 | 16 |
| ARC | 1 | 9 | 26 | 61 | 0 | dr3_15 | 10 | 10 | 2 | 39.5 | 16 |
| BAQ | 3 | 6 | 26 | 47 | 0 | dr3_10 | 18 | 18 | 2 | 44 | 10.5 |
| ETA | 167 | 482 | 1302 | 2425 | 0 | DR3_15 | 55 | 55 | 1.5 | 44.3 | 850 |
| GAQ | 3 | 7 | 46 | 41 | 0 | dr3_15 | 4.5 | 4.5 | 2 | 48 | 5 |
| PCY | 3 | 24 | 38 | 90 | 0 | dr3_20 | 1.5 | 1.5 | 1.7 | 49.5 | 9.5 |
| ELY | 7 | 41 | 146 | 203 | 0 | DR3_20 | 10 | 10 | 2 | 50.2 | 85 |
| MBC | 5 | 18 | 34 | 33 | 0 | dr3_15 | 50 | 50 | 2 | 55 | 10 |
| TAH | 0 | 0 | 0 | 1269 | 0 | Nr3 | 5500 | 3500 | 0.45 | 69.45 | 12000 |
| PAN | 0 | 4 | 12 | 30 | 0 | DR3_15 | 60 | 60 | 2 | 72 | 18.6 |
| JMC | 1 | 18 | 50 | 53 | 0 | DR3_20 | 10 | 10 | 1.8 | 72 | 40 |
| ARI | 10 | 20 | 46 | 50 | 0 | DR3_20 | 10 | 10 | 1.8 | 79.5 | 350 |
| JEC | 5 | 40 | 62 | 43 | 0 | DR3_20 | 40 | 40 | 1.8 | 82.6 | 40 |
| JRC | 1 | 14 | 42 | 52 | 0 | DR3_20 | 8 | 8 | 2 | 84 | 22 |
| SSG | 13 | 59 | 53 | 107 | 0 | DR3_20 | 14 | 14 | 2 | 87 | 9 |
| JBO | 1 | 3 | 1 | 34 | 0 | DR3_15 | 40 | 40 | 3 | 90.3 | 75 |
| DPI | 1 | 10 | 17 | 49 | 0 | DR3_20 | 350 | 350 | 1.2 | 91.2 | 14 |
| JEO | 38 | 14 | 4 | 41 | 0 | DR3_15 | 90 | 90 | 1.4 | 92 | 26 |
| JIP | 2 | 16 | 12 | 67 | 0 | DR3_10 | 80 | 80 | 2 | 94.1 | 50 |
| FPE | 3 | 13 | 4 | 40 | 0 | DR3_10 | 180 | 180 | 2 | 95.8 | 16 |
| PPS_0 | 21 | 98 | 51 | 216 | 0 | DR3_15 | 4 | 4 | 1.6 | 98.5 | 27 |
| NZC | 51 | 259 | 229 | 570 | 0 | DR3_20 | 4 | 4 | 1.8 | 101 | 40 |
| MIC | 11 | 46 | 67 | 156 | 0 | DR3_10 | 19 | 19 | 0.7 | 101.3 | 65 |
| TCS | 3 | 4 | 16 | 44 | 0 | DR3_10 | 19 | 19 | 1.8 | 104.6 | 11 |
| CAN | 14 | 114 | 168 | 383 | 0 | DR3_20 | 9 | 9 | 1.4 | 105 | 19 |
| JPE | 17 | 110 | 165 | 289 | 0 | DR3_15 | 25 | 25 | 1 | 109.6 | 45 |
| ZCS | 14 | 92 | 194 | 267 | 0 | DR3_20 | 10 | 10 | 1 | 113.6 | 45 |
| JXA | 6 | 44 | 51 | 75 | 0 | dr3_20 | 13 | 13 | 2 | 115 | 8 |
| XCS | 17 | 87 | 113 | 251 | 0 | Nr | 75 | 75 | 1.5 | 116.3 | 6.8 |
| PPS_1 | 3 | 39 | 64 | 109 | 0 | DR3_15 | 4.5 | 4.5 | 1.7 | 117.5 | 9.5 |
| GDR | 8 | 135 | 71 | 185 | 0 | DR3_20 | 37 | 37 | 1.5 | 125.5 | 95 |
| CAP | 86 | 586 | 455 | 1110 | 0 | DR3_20 | 25 | 35 | 1.6 | 126.9 | 140 |
| SDA | 256 | 1257 | 1185 | 3029 | 0 | DR3_20 | 15 | 17 | 1.2 | 126.9 | 440 |
| ERI | 56 | 155 | 224 | 416 | 0 | DR3_20 | 3 | 3 | 1.8 | 132.3 | 36 |
| AXC | 6 | 18 | 40 | 68 | 0 | DR3_20 | 25 | 25 | 1.2 | 135.5 | 9 |
| PER | 1296 | 6487 | 11913 | 16054 | 0 | DR3_20 | 20 | 20 | 2 | 140.5 | 1500 |
| KCG | 4 | 9 | 749 | 11 | 0 | DR3_20 | 8 | 8 | 1.3 | 141.5 | 52 |
| ADC | 4 | 11 | 11 | 144 | 0 | DR3_15 | 110 | 110 | 3 | 143.65 | 65 |
| AXD | 22 | 83 | 85 | 106 | 0 | Nr3 | 3.4 | 3.4 | 1.7 | 147.2 | 45 |
| NDA | 58 | 289 | 278 | 470 | 0 | DR3_20 | 3 | 3 | 2.2 | 149 | 17 |
| ZDR | 23 | 29 | 68 | 89 | 0 | Nr3 | 8 | 8 | 1.8 | 153.2 | 37 |
| AGC | 14 | 43 | 63 | 150 | 0 | DR3_20 | 8 | 8 | 3 | 155.4 | 9.3 |
| AUR | 31 | 46 | 109 | 147 | 0 | DR3_10 | 120 | 120 | 2 | 158.4 | 19 |
| PSO | 22 | 48 | 143 | 195 | 0 | DR3_20 | 4 | 4 | 2 | 160.4 | 11 |
| OMG | 14 | 33 | 80 | 102 | 0 | DR3_10 | 6 | 6 | 2 | 163.2 | 11.5 |
| NUE | 64 | 152 | 241 | 360 | 0 | DR3_20 | 2.5 | 3 | 2 | 165.5 | 11 |
| SPE | 93 | 212 | 421 | 259 | 0 | DR3_20 | 70 | 70 | 2 | 166.9 | 61 |
| NPI | 117 | 239 | 357 | 419 | 0 | DR3_20 | 2.3 | 2.3 | 1.8 | 167.2 | 12 |
| SLY_0 | 12 | 76 | 117 | 84 | 0 | DR3_20 | 10 | 10 | 2 | 169.5 | 12 |
| CCY | 0 | 223 | 6 | 7 | 0 | DR3_20 | 14 | 14 | 1.8 | 173.4 | 25 |
| DSX | 5 | 3 | 21 | 40 | 0 | DR3_20 | 15 | 15 | 2 | 188.5 | 230 |
| SLY_1 | 8 | 26 | 69 | 131 | 0 | DR3_10 | 3.5 | 3.5 | 2 | 191.5 | 6 |
| OCT | 27 | 9 | 55 | 154 | 0 | DR3_20 | 55 | 55 | 3 | 192.55 | 65 |
| SAN | 2 | 3 | 22 | 6 | 0 | Nr | 27 | 27 | 1.8 | 196.8 | 1.4 |
| XIE | 11 | 12 | 21 | 16 | 0 | DR3_6 | 18 | 18 | 1.8 | 198.2 | 30 |
| STA_SE | 235 | 519 | 918 | 935 | 0 | DR3_15 | 12.5 | 12.5 | 1.7 | 201.5 | 48 |
| OCU | 38 | 49 | 147 | 127 | 0 | DR3_15 | 30 | 30 | 2 | 202.5 | 65 |
| EGE | 71 | 87 | 199 | 358 | 0 | DR3_10 | 4.3 | 4.3 | 2 | 203.7 | 9 |
| LMI | 85 | 113 | 160 | 341 | 0 | DR3_20 | 12 | 12 | 1.5 | 209.2 | 40 |
| TCA | 59 | 63 | 213 | 283 | 0 | dr3_10 | 6.5 | 6.5 | 1.6 | 209.5 | 7.5 |
| ORI | 2165 | 2641 | 4574 | 10035 | 0 | DR3_10 | 37 | 37 | 1.3 | 209.5 | 320 |
| LUM | 13 | 8 | 67 | 109 | 0 | DR3_10 | 21 | 21 | 1.5 | 214.8 | 23 |
| SLD | 14 | 16 | 63 | 63 | 0 | DR3_20 | 21 | 21 | 1.3 | 221.5 | 15 |
| STA_SF | 285 | 190 | 767 | 3273 | 0 | DR15_2022 | 22 | 22 | 1.3 | 222.2 | 157 |
| KUM | 25 | 70 | 152 | 132 | 0 | DR3_20 | 9 | 9 | 1.4 | 222.8 | 19.5 |
| OER | 100 | 120 | 233 | 372 | 0 | Nr3 | 8 | 3 | 1.8 | 223 | 32 |
| AND | 53 | 104 | 635 | 255 | 0 | Nr_2021 | 20 | 20 | 2 | 224.5 | 23 |
| RPU | 11 | 32 | 40 | 47 | 0 | DR3_20 | 3.7 | 3.7 | 2 | 226.2 | 7 |
| NTA | 1051 | 1548 | 3040 | 3538 | 0 | DR3_20 | 19 | 19 | 1.3 | 226.5 | 112 |
| LEO | 305 | 741 | 1075 | 1697 | 0 | DR3_10 | 17 | 13 | 0.9 | 235.4 | 140 |
| ACA | 17 | 13 | 35 | 60 | 0 | dr3_20 | 4 | 4 | 1.5 | 239.5 | 12 |
| AMO | 26 | 29 | 46 | 85 | 0 | DR3_20 | 65 | 65 | 0.8 | 239.6 | 17 |
| NSU | 12 | 16 | 25 | 53 | 0 | DR3_6 | 35 | 35 | 1.3 | 241.7 | 8.5 |
| NOO | 277 | 310 | 959 | 1092 | 0 | DR3_10 | 5 | 5 | 1.4 | 246.1 | 40 |
| ORS | 64 | 84 | 169 | 369 | 0 | DR3_20 | 23 | 23 | 1.6 | 246.2 | 13 |
| NAC | 11 | 4 | 36 | 27 | 0 | DR3_20 | 8 | 8 | 1.6 | 246.5 | 8 |
| TPY_0 | 15 | 6 | 41 | 37 | 0 | DR3_20 | 15 | 15 | 2 | 249.4 | 11 |
| DKD | 99 | 25 | 261 | 114 | 0 | DR3_20 | 23 | 23 | 1.7 | 251 | 72 |
| PSU | 44 | 46 | 173 | 108 | 0 | DR3_15 | 12 | 12 | 0.9 | 251.5 | 13.7 |
| DAD | 60 | 86 | 267 | 271 | 0 | dr3_20 | 2 | 2 | 2 | 253.5 | 13 |
| HYD | 457 | 628 | 1832 | 1636 | 0 | DR3_20 | 7 | 7 | 1.2 | 255.4 | 190 |
| DRV | 25 | 31 | 101 | 89 | 0 | DR3_15 | 9 | 9 | 1.8 | 255.6 | 8 |
| EHY | 77 | 129 | 280 | 366 | 5 | DR3_20 | 14 | 14 | 1.4 | 256.2 | 22 |
| PUV | 10 | 11 | 93 | 144 | 0 | DR3_15 | 1.8 | 1.8 | 2.2 | 256.5 | 150 |
| MON | 168 | 304 | 752 | 678 | 0 | DR3_20 | 12 | 12 | 1.7 | 258.1 | 45 |
| GEM | 2375 | 6746 | 11150 | 16924 | 0 | DR3_15 | 37 | 37 | 1.7 | 261.85 | 7300 |
| XVI | 47 | 73 | 121 | 145 | 0 | dr3_10 | 21 | 21 | 2 | 262.8 | 21 |
| DAB | 5 | 14 | 21 | 51 | 0 | DR3_10 | 19 | 19 | 2 | 263.1 | 18 |
| TPY_1 | 11 | 17 | 31 | 50 | 0 | DR3_20 | 8 | 8 | 1.8 | 264.3 | 7.5 |
| COM | 321 | 730 | 941 | 2114 | 440 | DR3_20 | 12 | 12 | 1 | 267.5 | 67 |
| URS | 87 | 265 | 177 | 353 | 0 | DR3_20 | 47 | 47 | 1.2 | 270.65 | 470 |
| DSV | 76 | 127 | 255 | 439 | 86 | dr3_20 | 6 | 6 | 1.3 | 271.5 | 18 |
| KVE | 0 | 1 | 25 | 71 | 0 | DR3_15 | 11 | 11 | 0.9 | 274.9 | 36 |
| JLE | 0 | 12 | 8 | 23 | 12 | DR3_6 | 14 | 14 | 1.4 | 281.6 | 40 |
| QUA | 16 | 543 | 1239 | 1089 | 902 | DR3_20 | 42 | 42 | 1.8 | 283.25 | 1150 |
| AHY | 12 | 48 | 83 | 219 | 73 | dr3_15 | 6.6 | 6.6 | 1.4 | 283.8 | 47 |
| OLE | 0 | 8 | 14 | 33 | 19 | Nr | 23 | 23 | 1 | 288.3 | 2.2 |
| XCB | 0 | 14 | 27 | 38 | 62 | DR3_10 | 9 | 9 | 1.9 | 294.8 | 31 |
| XUM | 0 | 26 | 32 | 58 | 155 | Nr3 | 27 | 27 | 1.7 | 298.6 | 97 |
| GUM | 0 | 30 | 17 | 47 | 151 | DR3_20 | 15 | 15 | 1.8 | 299.8 | 26 |
| ACB | 6 | 25 | 19 | 114 | 125 | DR3_20 | 45 | 45 | 2 | 307.5 | 21 |
| AAN | 3 | 22 | 13 | 73 | 58 | DR3_20 | 4.5 | 4.5 | 1.7 | 312.5 | 7.5 |
| FED | 3 | 9 | 5 | 39 | 18 | DR3_15 | 70 | 70 | 1 | 314.84 | 58 |
| FHY | 0 | 2 | 7 | 5 | 47 | DR3_6 | 180 | 180 | 0.8 | 325.4 | 25 |
| TTR | 0 | 0 | 0 | 6 | 28 | DR3_20 | 15 | 15 | 0.8 | 332.1 | 21 |
| DNO | 0 | 1 | 2 | 10 | 33 | DR3_20 | 20 | 20 | 0.8 | 334.2 | 13 |
| TSB | 2 | 6 | 11 | 36 | 0 | DR3_15 | 62 | 62 | 1 | 343.7 | 15 |
| XHE | 0 | 10 | 23 | 77 | 0 | DR3_20 | 10 | 10 | 1.6 | 351.9 | 16 |
| EVI | 3 | 19 | 194 | 124 | 0 | DR3_15 | 38 | 38 | 1 | 358 | 15 |
| EOP | 0 | 14 | 21 | 23 | 0 | dr3_6 | 24 | 24 | 1.5 | 358.2 | 12 |
Table 7 shows the radiant point geocentric velocity, and orbital elements corresponding to the maximum of the meteor shower estimated in Table 6. This table summarizes this paper. It should be noted that these values are different from the commonly used average value for all observed meteors and are values corresponding to the maximum.
Table 7 – Radiant points and orbital elements at the maximum of the meteor shower.
| Code | Radiant point | Orbital elements | ||||||||||||
| λʘ | l–λʘ | b | a | d | vg | e | q | i | w | W | lP | bP | a | |
| BCO | 13 | 174.6 | 30.1 | 199.6 | 24.5 | 26.6 | 0.945 | 0.696 | 22.7 | 248 | 13 | 259.4 | -21 | 12.74 |
| ZCY | 16 | 300.4 | 59.1 | 299.2 | 40.2 | 43.5 | 0.867 | 0.909 | 74.3 | 143.4 | 16 | 184.6 | 35.1 | 6.84 |
| DHE | 19.6 | 231.9 | 46.5 | 256.2 | 23.9 | 49.3 | 0.944 | 0.749 | 85.1 | 241.2 | 19.6 | 208.4 | -60.9 | 13.44 |
| AED | 20 | 293.1 | 30.1 | 307.2 | 12 | 60.6 | 0.949 | 0.734 | 121.4 | 116.8 | 20 | 245.9 | 49.7 | 14.37 |
| PSR | 24.7 | 211.4 | 34.7 | 241.7 | 14.6 | 45.1 | 0.985 | 0.439 | 67.9 | 277.7 | 24.7 | 314.4 | -66.7 | 29.15 |
| AVB | 25 | 171.4 | 11.7 | 199.6 | 4.4 | 19.7 | 0.725 | 0.709 | 7 | 252.4 | 25 | 277.3 | -6.7 | 2.57 |
| ZCY | 31.5 | 299.1 | 58.1 | 308.6 | 42.5 | 41.8 | 0.721 | 0.904 | 73.7 | 139.4 | 31.5 | 198 | 38.6 | 3.25 |
| LYR | 32.3 | 240.8 | 56.7 | 272.1 | 33.3 | 46.6 | 0.951 | 0.919 | 79.4 | 214.6 | 32.3 | 219.5 | -33.9 | 18.64 |
| HVI | 39 | 166.2 | -1.3 | 202.9 | -11 | 18.4 | 0.739 | 0.758 | 0.7 | 65.2 | 219 | 284.2 | 0.7 | 2.91 |
| ARC | 39.5 | 312.7 | 56.5 | 323.8 | 47.3 | 41.3 | 0.852 | 0.834 | 69.6 | 128.8 | 39.5 | 196.1 | 46.9 | 5.66 |
| BAQ | 44 | 279.3 | 13.3 | 321.3 | -1.2 | 68.3 | 0.914 | 0.929 | 156.5 | 146.6 | 44 | 255.1 | 12.7 | 10.86 |
| ETA | 44.3 | 294 | 7.6 | 337.1 | -1.4 | 65.4 | 0.949 | 0.564 | 163.7 | 95.4 | 44.3 | 308.6 | 16.2 | 11.06 |
| GAQ | 48 | 262.5 | 33.3 | 304.1 | 14.5 | 62 | 0.911 | 0.984 | 122.8 | 198.8 | 48 | 217.5 | -15.7 | 11 |
| PCY | 49.5 | 278.1 | 71.5 | 296.6 | 53.4 | 39.4 | 0.93 | 1.007 | 65.4 | 173.8 | 49.5 | 226.9 | 5.7 | 14.42 |
| ELY | 50.2 | 256.3 | 64.5 | 290.7 | 43.7 | 44 | 0.955 | 1 | 74.4 | 191.6 | 50.2 | 233.4 | -11.1 | 21.99 |
| MBC | 55 | 245.8 | 4.8 | 302 | -15.3 | 65.7 | 0.932 | 0.565 | 169.7 | 265.1 | 55 | 150 | -10.3 | 8.29 |
| TAH | 69.45 | 125.3 | 36.9 | 208.9 | 28 | 11.4 | 0.641 | 0.991 | 10.5 | 199.5 | 69.5 | 268.7 | -3.5 | 2.76 |
| PAN | 72 | 307.1 | 43.6 | 355.3 | 46.6 | 50.4 | 0.963 | 0.713 | 89.6 | 113.3 | 72 | 251 | 66.7 | 19.54 |
| JMC | 72 | 323.5 | 43.6 | 10.7 | 53.2 | 42.7 | 0.912 | 0.6 | 69.5 | 98.3 | 72 | 184.6 | 68 | 6.85 |
| ARI | 79.5 | 330.6 | 7.8 | 45.3 | 25.2 | 40.8 | 0.97 | 0.071 | 30.1 | 27.3 | 79.5 | 103.6 | 13.3 | 2.37 |
| JEC | 82.6 | 249.2 | 47.9 | 315.3 | 33.7 | 52.7 | 0.949 | 0.921 | 95.5 | 216 | 82.6 | 258.6 | -35.8 | 18.02 |
| JRC | 84 | 262.2 | 55.4 | 320.7 | 44.5 | 49.7 | 0.938 | 1.007 | 88.2 | 190.6 | 84 | 264.3 | -10.6 | 16.16 |
| SSG | 87 | 186.7 | -6.5 | 274.2 | -29.9 | 25.2 | 0.777 | 0.462 | 6.2 | 104.3 | 267 | 11.4 | 6 | 2.07 |
| JBO | 90.3 | 101.2 | 59.4 | 221.1 | 48.5 | 14 | 0.68 | 1.015 | 18.4 | 184.7 | 90.3 | 274.8 | -1.5 | 3.17 |
| DPI | 91.2 | 280.4 | 1 | 10.2 | 5.5 | 69.8 | 0.962 | 0.919 | 178.1 | 143.5 | 91.2 | 307.7 | 1.1 | 24.12 |
| JEO | 92 | 152.7 | 13.1 | 245.1 | -8.2 | 13.7 | 0.659 | 0.889 | 5 | 226.8 | 92 | 318.7 | -3.7 | 2.61 |
| JIP | 94.1 | 252.4 | 37.8 | 331.7 | 29.3 | 58.5 | 0.955 | 0.898 | 112.4 | 220.4 | 94.1 | 256.1 | -36.8 | 20.17 |
| FPE | 95.8 | 254.9 | 15.9 | 345.2 | 11 | 66.7 | 0.936 | 0.843 | 150.7 | 229.6 | 95.8 | 230.1 | -21.9 | 13.17 |
| PPS_0 | 98.5 | 282.9 | 16.1 | 13.3 | 23.2 | 66.3 | 0.876 | 0.879 | 150.8 | 135.2 | 98.5 | 319.4 | 20.1 | 7.06 |
| NZC | 101 | 209.5 | 12.4 | 309.6 | -5.6 | 38.9 | 0.942 | 0.11 | 38.3 | 327 | 101 | 74 | -19.7 | 1.9 |
| MIC | 101.3 | 208.8 | -10.3 | 315.7 | -27.6 | 40 | 0.958 | 0.094 | 34.9 | 148.7 | 281.3 | 74.8 | 17.3 | 2.24 |
| TCS | 104.6 | 303.6 | 52.7 | 13.7 | 65.4 | 46.3 | 0.893 | 0.858 | 80.9 | 131.9 | 104.6 | 274.6 | 47.3 | 8.03 |
| CAN | 105 | 298.1 | 32.8 | 27 | 46.5 | 57.1 | 0.918 | 0.684 | 112.9 | 108.5 | 105 | 334.4 | 60.9 | 8.35 |
| JPE | 109.6 | 244.6 | 14.6 | 348.8 | 11.1 | 63.8 | 0.949 | 0.574 | 148.6 | 263.9 | 109.6 | 206.7 | -31.2 | 11.34 |
| ZCS | 113.6 | 277.9 | 42.7 | 7.5 | 50.8 | 57.1 | 0.934 | 0.996 | 107.6 | 163.5 | 113.6 | 298.7 | 15.7 | 15.02 |
| JXA | 115 | 283.2 | -5.5 | 37.7 | 9 | 68.8 | 0.937 | 0.865 | 169.9 | 313.7 | 295 | 340.8 | -7.3 | 13.73 |
| XCS | 116.3 | 185.1 | 8.4 | 301.8 | -11.7 | 25.1 | 0.791 | 0.486 | 7.7 | 280.5 | 116.3 | 36.9 | -7.5 | 2.32 |
| PPS_1 | 117.5 | 280.5 | 17.7 | 29.1 | 30.8 | 66.1 | 0.842 | 0.926 | 148.3 | 143.8 | 117.5 | 329.4 | 18.1 | 5.86 |
| GDR | 125.5 | 167.3 | 73.4 | 280.1 | 50.7 | 27.6 | 0.978 | 0.978 | 40.4 | 202.1 | 125.5 | 322.7 | -14.1 | 44.39 |
| CAP | 126.9 | 178.6 | 9.9 | 305.4 | -9.3 | 22.1 | 0.759 | 0.599 | 7.2 | 267.1 | 126.9 | 33.9 | -7.2 | 2.49 |
| SDA | 126.9 | 208.4 | -7.4 | 340 | -16.4 | 40.4 | 0.968 | 0.079 | 26.8 | 151.1 | 306.9 | 100.7 | 12.6 | 2.47 |
| ERI | 132.3 | 260 | -27.4 | 39.5 | -13.5 | 64.2 | 0.942 | 0.951 | 132.2 | 29.4 | 312.3 | 291.6 | 21.4 | 16.31 |
| AXC | 135.5 | 252.1 | 42.6 | 3.8 | 49.1 | 55.5 | 0.914 | 0.909 | 104.2 | 218.5 | 135.5 | 304.5 | -37.1 | 10.56 |
| PER | 140.5 | 283.4 | 38.3 | 49.2 | 58.1 | 58.8 | 0.923 | 0.945 | 113 | 149.4 | 140.5 | 333.5 | 27.9 | 12.3 |
| KCG | 141.5 | 162.9 | 71.1 | 286.4 | 49.6 | 22.4 | 0.724 | 0.971 | 33.9 | 205.8 | 141.5 | 343.3 | -14 | 3.51 |
| ADC | 143.6 | 180.1 | 2.2 | 325.3 | -11.5 | 23.8 | 0.81 | 0.552 | 1.8 | 270.9 | 143.7 | 54.6 | -1.8 | 2.91 |
| AXD | 147.2 | 140.6 | 82.8 | 274.3 | 59.7 | 21.8 | 0.654 | 1.006 | 34.8 | 189.4 | 147.2 | 334.9 | -5.3 | 2.91 |
| NDA | 149 | 206.8 | 7 | 353.4 | 4.8 | 37.9 | 0.95 | 0.105 | 20.4 | 327.2 | 149 | 117.9 | -10.9 | 2.09 |
| ZDR | 153.2 | 52.7 | 84.6 | 258.9 | 63.8 | 21.9 | 0.647 | 1.01 | 35 | 176.7 | 153.2 | 330.5 | 1.9 | 2.86 |
| AGC | 155.4 | 263.2 | 63.6 | 358 | 76.6 | 43.9 | 0.892 | 1.005 | 75.6 | 188.1 | 155.4 | 337.4 | -7.8 | 9.28 |
| AUR | 158.4 | 292.6 | 15.8 | 91.2 | 39.2 | 65.5 | 0.961 | 0.667 | 148.2 | 108 | 158.4 | 47.5 | 30.1 | 16.93 |
| PSO | 160.4 | 267.4 | -24.3 | 69.8 | -2.4 | 65.5 | 0.874 | 1.002 | 138.3 | 9.5 | 340.4 | 333.3 | 6.3 | 7.96 |
| OMG | 163.2 | 307.1 | 17.1 | 115.2 | 38.8 | 58.1 | 0.948 | 0.3 | 130.8 | 63.7 | 163.2 | 110.3 | 42.7 | 5.72 |
| NUE | 165.5 | 259.1 | -21.3 | 66.4 | 0.1 | 65.4 | 0.866 | 0.912 | 141.9 | 37.3 | 345.5 | 314.6 | 22 | 6.78 |
| SPE | 166.9 | 249.1 | 21.1 | 47.4 | 39.6 | 64 | 0.944 | 0.718 | 138.7 | 245.9 | 166.9 | 287.6 | -37.1 | 12.76 |
| NPI | 167.2 | 196.7 | 3.8 | 2.1 | 5.1 | 28.7 | 0.83 | 0.287 | 5.1 | 305.2 | 167.2 | 112.5 | -4.2 | 1.68 |
| SLY_0 | 169.5 | 294.9 | 33.5 | 111.7 | 55.8 | 58.7 | 0.928 | 0.752 | 114.6 | 118.4 | 169.5 | 27.1 | 53.1 | 10.47 |
| CCY | 173.4 | 140.1 | 52.6 | 300.2 | 33.6 | 14.7 | 0.651 | 0.958 | 18.3 | 208.4 | 173.4 | 20.6 | -8.6 | 2.74 |
| DSX | 188.5 | 330.6 | -11.5 | 156.5 | -2.5 | 32.3 | 0.869 | 0.147 | 24.3 | 213.4 | 8.5 | 219.5 | -13.1 | 1.12 |
| SLY_1 | 191.5 | 277.5 | 23.9 | 115.2 | 45.7 | 66.3 | 0.919 | 0.966 | 138.5 | 158.4 | 191.5 | 28 | 14.1 | 11.97 |
| OCT | 192.6 | 281.6 | 62 | 167.6 | 78.6 | 45.8 | 0.946 | 0.991 | 77.9 | 169.1 | 192.6 | 10.2 | 10.7 | 18.44 |
| SAN | 196.8 | 214.4 | 29.8 | 37.9 | 46.5 | 16.9 | 0.516 | 0.396 | 21.4 | 320.5 | 196.8 | 159.3 | -13.4 | 0.82 |
| XIE | 198.2 | 228.1 | -27.8 | 69.1 | -6.1 | 54.2 | 0.981 | 0.383 | 103 | 104.1 | 18.2 | 240 | 70.9 | 19.75 |
| STA_SE | 201.5 | 195.8 | -4.4 | 36.4 | 9.8 | 28.8 | 0.831 | 0.301 | 5.7 | 122.6 | 21.5 | 144.2 | 4.8 | 1.78 |
| OCU | 202.5 | 279.1 | 46.8 | 145.7 | 64.2 | 55.5 | 0.942 | 0.979 | 100.7 | 164.2 | 202.5 | 25.5 | 15.5 | 16.87 |
| EGE | 203.7 | 254.9 | 5.1 | 99.7 | 28.3 | 68.7 | 0.917 | 0.789 | 170.4 | 235.7 | 203.7 | 328.4 | -7.9 | 9.52 |
| LMI | 209.2 | 298 | 26.2 | 160.3 | 36.8 | 61.3 | 0.959 | 0.616 | 124.5 | 102.8 | 209.2 | 97.3 | 53.4 | 15.15 |
| TCA | 209.5 | 283.4 | 13.4 | 139.7 | 29.8 | 67 | 0.808 | 0.843 | 155.1 | 131.2 | 209.5 | 75.5 | 18.5 | 4.39 |
| ORI | 209.5 | 246.6 | -7.5 | 96.3 | 15.8 | 65.5 | 0.916 | 0.557 | 163.8 | 85.4 | 29.5 | 304.3 | 16.1 | 6.65 |
| LUM | 214.8 | 284.4 | 36.8 | 158.2 | 49.2 | 60.5 | 0.952 | 0.915 | 115.1 | 146.9 | 214.8 | 50.3 | 29.6 | 18.91 |
| SLD | 221.5 | 265.2 | 53.5 | 161.6 | 68 | 48.9 | 0.741 | 0.986 | 88.5 | 189.8 | 221.5 | 41.8 | -9.8 | 3.81 |
| STA_SF | 222.2 | 192.3 | -4.5 | 53.2 | 14.5 | 28.5 | 0.837 | 0.351 | 5.4 | 114.7 | 42.2 | 157 | 4.9 | 2.16 |
| KUM | 222.8 | 268 | 29.7 | 144.4 | 45.8 | 64.8 | 0.933 | 0.988 | 129.2 | 186.9 | 222.8 | 38.4 | -5.3 | 14.81 |
| OER | 223 | 187.1 | -18.7 | 52.6 | -0.3 | 28.7 | 0.874 | 0.472 | 19.1 | 97.1 | 43 | 140.5 | 18.9 | 3.74 |
| AND | 224.5 | 165.9 | 18.2 | 21.2 | 28.5 | 18.1 | 0.751 | 0.763 | 9.4 | 242.4 | 224.5 | 106.6 | -8.3 | 3.06 |
| RPU | 226.2 | 269.6 | -43.5 | 125.1 | -25.5 | 57.5 | 0.902 | 0.99 | 106.3 | 2.2 | 46.2 | 45.6 | 2.1 | 10.14 |
| NTA | 226.5 | 192.1 | 2.4 | 55.8 | 22.2 | 28.3 | 0.833 | 0.352 | 2.9 | 294.7 | 226.5 | 161.2 | -2.6 | 2.11 |
| LEO | 235.4 | 272.5 | 10.3 | 153.9 | 21.8 | 69.7 | 0.829 | 0.984 | 162 | 171.6 | 235.4 | 63.4 | 2.6 | 5.74 |
| ACA | 239.5 | 216.8 | -41.8 | 95 | -18.5 | 43.7 | 0.917 | 0.553 | 70 | 85.4 | 59.5 | 136.3 | 69.5 | 6.69 |
| AMO | 239.6 | 239.5 | -19.9 | 117.2 | 0.8 | 61.7 | 0.963 | 0.469 | 133.3 | 94 | 59.6 | 323.7 | 46.5 | 12.74 |
| NSU | 241.7 | 245.1 | 43.2 | 148.9 | 59.4 | 54.4 | 0.925 | 0.813 | 98.9 | 230.8 | 241.7 | 51 | -49.9 | 10.88 |
| NOO | 246.1 | 204 | -7.9 | 90.1 | 15.5 | 42.9 | 0.992 | 0.111 | 24.6 | 141.4 | 66.1 | 210.2 | 15 | 13.22 |
| ORS | 246.2 | 190.1 | -4.7 | 75.6 | 18 | 27.4 | 0.82 | 0.392 | 5.1 | 109.7 | 66.2 | 175.9 | 4.8 | 2.18 |
| NAC | 246.5 | 286.2 | -20.5 | 165 | -16 | 66.6 | 0.934 | 0.812 | 141.8 | 309.3 | 66.5 | 110.3 | -28.6 | 12.31 |
| TPY_0 | 249.4 | 261.2 | -39.3 | 138.3 | -25.5 | 60.1 | 0.951 | 0.955 | 112.5 | 20.7 | 69.4 | 61.2 | 19.1 | 19.52 |
| DKD | 251 | 243 | 61.5 | 186.1 | 70.5 | 43.8 | 0.91 | 0.929 | 73.2 | 208.6 | 251 | 79.9 | -27.3 | 10.28 |
| PSU | 251.5 | 258 | 35.6 | 168.1 | 44.2 | 60.9 | 0.896 | 0.917 | 117.2 | 211.4 | 251.5 | 55.9 | -27.6 | 8.78 |
| DAD | 253.5 | 264.2 | 62.7 | 204.6 | 62.2 | 40.6 | 0.604 | 0.981 | 72 | 188.5 | 253.5 | 76.1 | -8.1 | 2.48 |
| HYD | 255.4 | 231 | -16.5 | 124.7 | 2.7 | 58.8 | 0.982 | 0.255 | 129.1 | 119.7 | 75.4 | 303.2 | 42.4 | 14.27 |
| DRV | 255.6 | 286 | 15 | 187.5 | 13.1 | 68.2 | 0.935 | 0.795 | 152 | 126.8 | 255.6 | 125.3 | 22.1 | 12.16 |
| EHY | 256.2 | 237.8 | -14.8 | 132.2 | 2.4 | 62.1 | 0.964 | 0.375 | 142.3 | 105.1 | 76.2 | 327.3 | 36.2 | 10.31 |
| PUV | 256.5 | 268.3 | -61.6 | 134.7 | -49.2 | 41.6 | 0.612 | 0.984 | 74.1 | 3.2 | 76.5 | 77.4 | 3 | 2.53 |
| MON | 258.1 | 202.5 | -14.8 | 100.4 | 8.3 | 41.4 | 0.983 | 0.185 | 35.3 | 129.8 | 78.1 | 213.6 | 26.4 | 10.71 |
| GEM | 261.8 | 208 | 10.5 | 113.3 | 32.4 | 33.8 | 0.889 | 0.146 | 22.9 | 324.1 | 261.9 | 228.1 | -13.2 | 1.31 |
| XVI | 262.8 | 291.6 | -5.2 | 191.3 | -10.5 | 68.1 | 0.95 | 0.624 | 169.4 | 284.4 | 82.8 | 158.2 | -10.3 | 12.45 |
| DAB | 263.1 | 298.1 | 32.6 | 212.1 | 21.9 | 59.4 | 0.972 | 0.675 | 113.5 | 111.2 | 263.1 | 128.9 | 58.7 | 24.18 |
| TPY_1 | 264.3 | 259.6 | -32.9 | 152 | -23.9 | 63 | 0.936 | 0.929 | 122.5 | 27.9 | 84.3 | 68.4 | 23.2 | 14.46 |
| COM | 267.5 | 242.9 | 21.1 | 161 | 30.9 | 62.8 | 0.943 | 0.557 | 134.2 | 263.9 | 267.5 | 6.2 | -45.5 | 9.77 |
| URS | 270.6 | 218.8 | 72.1 | 219.4 | 75.4 | 33.1 | 0.814 | 0.94 | 52.8 | 205.6 | 270.7 | 106.8 | -20.2 | 5.06 |
| DSV | 271.5 | 293.4 | 15 | 208.5 | 4.4 | 66.1 | 0.95 | 0.612 | 148.8 | 103 | 271.5 | 166.4 | 30.3 | 12.23 |
| KVE | 274.9 | 259.4 | -59.6 | 142.3 | -50.5 | 43.3 | 0.657 | 0.969 | 76.8 | 15.4 | 94.9 | 98.5 | 15 | 2.82 |
| JLE | 281.6 | 219.5 | 10.2 | 147 | 24.1 | 51.9 | 0.991 | 0.049 | 103.6 | 335.3 | 281.6 | 287.8 | -23.9 | 5.67 |
| QUA | 283.2 | 276.7 | 63.8 | 230 | 49.7 | 40.4 | 0.64 | 0.98 | 70.9 | 172 | 283.3 | 100.6 | 7.5 | 2.72 |
| AHY | 283.8 | 207.9 | -26.2 | 127.1 | -8 | 43.6 | 0.969 | 0.285 | 58.1 | 116.2 | 103.8 | 236.8 | 49.6 | 9.28 |
| OLE | 288.3 | 209.2 | -7.3 | 137.7 | 8.6 | 46.5 | 0.995 | 0.052 | 37.4 | 154 | 108.3 | 267.1 | 15.4 | 10.11 |
| XCB | 294.8 | 307.3 | 50.8 | 250.2 | 29.3 | 45.4 | 0.826 | 0.775 | 78.1 | 122 | 294.8 | 96.5 | 56 | 4.45 |
| XUM | 298.6 | 218.1 | 25.8 | 169.5 | 32.8 | 41 | 0.853 | 0.221 | 67.2 | 313.2 | 298.6 | 276.2 | -42.2 | 1.5 |
| GUM | 299.8 | 218.8 | 74.5 | 229.7 | 67.3 | 29.4 | 0.654 | 0.954 | 48.2 | 202.7 | 299.8 | 135.4 | -16.7 | 2.75 |
| ACB | 307.5 | 271.4 | 44.7 | 231.3 | 27.9 | 57.2 | 0.918 | 0.984 | 104.5 | 176.5 | 307.5 | 128.4 | 3.4 | 11.97 |
| AAN | 312.5 | 211 | -17.4 | 158.1 | -9.6 | 43.9 | 0.957 | 0.138 | 56.6 | 139.3 | 132.5 | 287.2 | 33 | 3.19 |
| Code | Radiant point | Orbital elements | ||||||||||||
| λʘ | l–λʘ | b | a | d | vg | e | q | i | w | W | lP | bP | a | |
| FED | 314.8 | 230.6 | 76 | 239.3 | 61.8 | 35.2 | 0.947 | 0.97 | 55.3 | 194.6 | 314.8 | 143.2 | -11.9 | 18.28 |
| FHY | 325.4 | 160.7 | -18.9 | 123.9 | 0.4 | 16.1 | 0.693 | 0.823 | 8.4 | 53.6 | 145.4 | 198.7 | 6.8 | 2.68 |
| TTR | 332.1 | 285.4 | -43.9 | 247 | -66.4 | 56.3 | 0.939 | 0.916 | 103 | 328 | 152.1 | 160.1 | -31.1 | 14.94 |
| DNO | 334.2 | 271.5 | -24.9 | 237.8 | -45.7 | 66.7 | 0.918 | 0.987 | 137.3 | 354.2 | 154.2 | 158.5 | -4 | 11.99 |
| TSB | 343.7 | 220.8 | 36.7 | 216.7 | 24.6 | 49.4 | 0.987 | 0.497 | 82 | 270.2 | 343.7 | 255.1 | -82 | 37.88 |
| XHE | 351.9 | 249 | 70.8 | 255.9 | 48.8 | 34.5 | 0.629 | 0.982 | 59.3 | 194.1 | 351.9 | 179.2 | -12.1 | 2.65 |
| EVI | 358 | 187 | 5.3 | 186.7 | 2.8 | 27.2 | 0.818 | 0.439 | 5.4 | 284 | 358 | 282 | -5.2 | 2.42 |
| EOP | 358.2 | 262.8 | 6.7 | 260.7 | -16.5 | 70.8 | 0.937 | 0.954 | 168.4 | 204 | 358.2 | 154.6 | -4.7 | 15.23 |
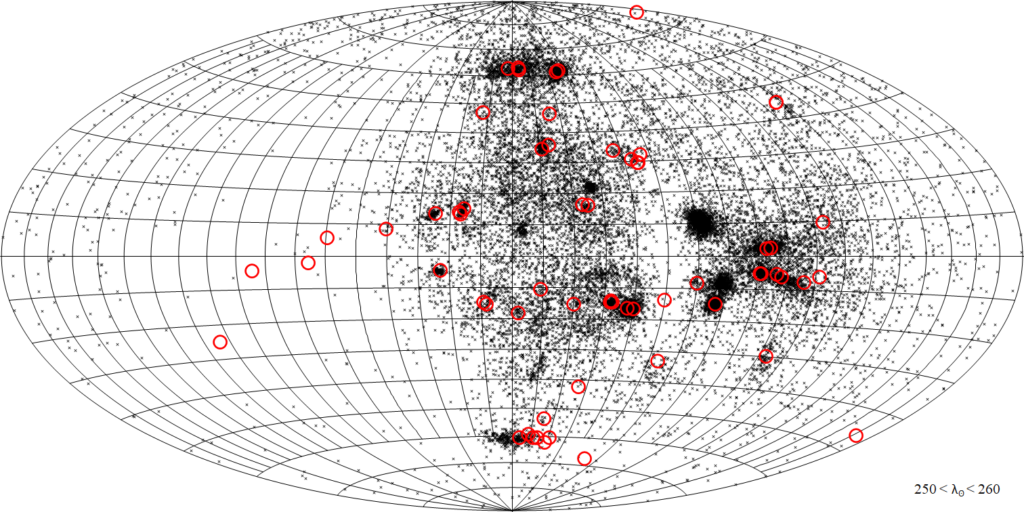
Figure 9 – Radiats observed in GMN with λʘ = 250~260 expressed in (λ–λʘ, β) coordinate system, point distribution. The center is (λ–λʘ, β) = (270, 0).
4 Comparison with the previous meteor shower table
Many of those that appeared for the first time had weak activity, so it was not possible to clearly capture their activity in the previous paper. Also, some meteor showers in the southern sky are now included. On the other hand, those not covered in this article include 0027KSE, 0152NOC, 0183PAU, 0388CTA, 0097SCC, and 0096NCC. In the case of KSE, this is because KSE03, which was the previous origin, has been deleted from the IAUMDCSD. For more information, please refer to part II. “Meteor showers that require attention”. The other four activities did not meet the criteria when applied this time. We also explained SCC and NCC in detail in part II.
The survey method is the same as in the previous paper, but the only difference is that to determine whether a meteor belongs to a meteor shower, we exclude meteors that are more than ±3 km/s away from the regression line of the geocentric velocity. This is because many meteor showers appear not so frequently as sporadic meteors, so it is necessary to exclude those that may be sporadic meteors. This difference does not have a large effect on the meteor showers discussed in the previous article. The major difference between the previous paper and this paper is in the database used, so we will explain the differences between the SonotaCo net data and GMN. There are four points.
The first is the difference in the number of meteors. The number of GMN meteors used here was more than twice that of the previous one, and as a result, even weaker meteor showers were detected. However, the number of GMN observations is increasing exponentially, and care must be taken when considering annual changes in meteor showers. Also, it must be noted that this often depends on observations in 2022, and observation conditions in 2022 have a large influence.
The second difference is the observation period. In the previous paper, we used SonotaCo net observations from 2007 to 2018, but the GMN observations used in this paper are from 2019 to February 2023. As a result, we were unable to discuss the activity of the Orionids, which became active from 2007 to 2009, but on the other hand, we obtained data on the outbursts of the Andromedids in 2021 and the 73P/Schwassmann-Wachmann 3 comet-related event in 2022.
The third difference is that the observation points are spread out in longitude. Observations were mainly made in Western Europe and North America, but we were able to obtain continuous observations for almost half a day, making it possible to capture meteor showers whose peaks last for only a short period. This is also why GMN captures the outbursts mentioned above. However, since the number of observation points differs depending on the longitude, it is natural that an increase or decrease in the number of meteors does not necessarily indicate a change in the activity of the meteor shower, so care must be taken.
Finally, GMN includes observations of the southern sky. Although the number of observations is still small, it is now possible to capture activity in the southern sky, as shown in Figure 9. In this paper, we were able to investigate meteor showers with declinations south of –40 degrees, such as 0255PUV00, 0784KVE00, 1166TTR00, and 0915DNO00. It is expected that future developments will lead to the discovery of new meteor showers and provide useful knowledge about meteor showers, which had previously been discussed only through visual observation.
Acknowledgment
This paper would not have been possible without the dedicated efforts of the observers, and the author would like to express his heartfelt gratitude to the members of SonotaCo net and GMN.
References
Koseki M. (2021). “The activity of meteor showers recorded by SonotaCo Net video observations 2007–2018”. eMetN, 6, 91–246.
Southworth R. B. and Hawkins G. S. (1963). “Statistics of meteor streams”. Smithsonian Contributions to Astrophysics, 7, 261–285.
Vida D., Gural P., Brown P., Campbell–Brown M., Wiegert P. (2019). “Estimating trajectories of meteors: an observational Monte Carlo approach – I. Theory”. Monthly Notices of the Royal Astronomical Society, 491, 2688–2705.
Vida D., Gural P., Brown P., Campbell–Brown M., Wiegert P. (2020). “Estimating trajectories of meteors: an observational Monte Carlo approach – II. Results”. Monthly Notices of the Royal Astronomical Society, 491, 3996–4011.
Vida D., Šegon D., Gural P. S., Brown P. G., McIntyre M. J. M., Dijkema T. J., Pavletić L., Kukić P., Mazur M. J., Eschman P., Roggemans P., Merlak A., Zubrović D. (2021). “The Global Meteor Network – Methodology and first results”. Monthly Notices of the Royal Astronomical Society, 506, 5046–5074.