Abstract: Virginids were classified as an ecliptic shower or one of the ANT sources. Recent developments of video meteor observations made it possible to distinguish minor showers from the background sporadics. We investigated three such small but interesting showers of the Virginids by using SonotaCo network observations (SonotaCo, 2009); EVI#0011, AVB#0021 and HVI#0343. Observations of these showers have been carried out almost equally and we can easily see the changes in the activity year by year.
EVI#0011 and HVI#0343 have both a periodic nature and a sharp maximum. AVB#0021 is a typical ANT shower. Their radiant distributions are compact and their radii are smaller than 3 degrees from the center taking their radiant drift into consideration.
1 Introduction
“Virginids” have been noticed since the 19th century (see Table 1) and were described as being rich in fireballs and slow meteors (Denning, 1898). Hoffmeister and McIntosh showed the Virginids have a complex and broadened structure (Hoffmeister, 1948; McIntosh, 1935).
The development of photographic observing techniques revealed the individual components in the “Virginids”. Whipple (1954) observed the EVI#0011 (η-Virginids) as the “Virginids” described earlier by Hoffmeister and these were later renamed as η-Virginids by Jenniskens (2006). McCrosky and Posen (1959) noticed the “Virginids” activity in early May and called them the “α-Virginids”.
Unfortunately, further developments with especially the great amount of video data caused confusion. The IAUMDC Meteor Shower Database (SD) lists the reports from research accordingly to the naming by the authors. For example, AVB#0021 is not the original “α-Virginids” and may consist of late HVI#0343 and sporadics; HVI#0343-0 was detected by SonotaCo (2009) though was thought to be a rediscovery of the “α-Virginids” (Koseki, 2019a). AVB#0021-04, -05 and SLE#0136-02 may suggest another new meteor shower and could be called σ-Virginids as appropriate designation (Koseki, 2019a).
We try to survey the three “Virginids” mentioned above: EVI#0011 (originally Whipple’s “Virginids”), AVB#0021 (newly found “σ-Virginids” and HVI#0343 (thought to be McCrosky and Posen’s “α-Virginids”).
2 Methods of survey
There are several sources of video meteor observations but the SonotaCo (2009) database is the most suitable to research meteor shower activities, because the observations have been carried out consistently. We use their results throughout this entire study.
2.1 Estimation of the radiant drift
A meteor shower radiant usually shifts with time in equatorial coordinates but is almost stationary for the Sun centered ecliptic coordinates (λ−λʘ, β) in general. The radiant shift can be represented as a short line in the orthographic projection of the (λ−λʘ, β) coordinates even if the radiant moves in the (λ−λʘ, β) coordinates. We select the entries in the SD as representatives of each showers and calculate the linear regression of x and y on λʘ for the period listed in Table 2; (x, y) are the coordinates of individual radiants centered at the shower radiant. The regression calculations were repeated several times to become stable.
Table 1 – The noticeable meteor showers by visual meteor observations in the 19th century (Denning, 1898).
| No. | Name | α | δ | N | Remarks |
| 136 | η Virginids | 180.7° | +1.7° | 4 | Needs further confirmation. |
| 149 | δ Virginids | 192.4° | +5.6° | 10 | Near 154, but probably quite different. |
| 154 | ο Virginids | 201.7° | +7.8° | 15 | Well-defined shower from April to May. |
| 158 | α Virginids | 205.4° | –8.7° | 22 | Supplies many large slow-moving meteors in April. Distinct from 166. |
| 166 | μ Viginids | 216.7° | –8.6° | 14 | Rich shower distinct from 158. Yields many slow-moving fireballs in April and May. |
Table 2 – Conditions for the survey; Δr is the search radius in degrees from the radiant point and Δλʘ is the search period; originally λʘ of AVB#0021-04 is 32° but the activity profile suggests that λʘ = 27° is better.
| Code | λʘ | λ−λʘ | β | Δr | Δλʘ |
| EVI#0011-02 | 357° | 185.9° | +5.5 | 3° | 7° |
| AVB#0021-04 | 27° | 168.7 | +11.8 | 3° | 10° |
| HVI#0343-03 | 40.6° | 165.6 | –1.3 | 3° | 5° |
2.2 Activity profile based on the radiant density
We can count the number of radiant points according to the distance from the estimated radiant position in (λ−λʘ, β), compensated for the radiant drift. Nr <= 3 is the number of meteors within 3 degrees from the estimated radiant in each 1-degree bin of λʘ. These raw meteor numbers fluctuate widely with the observing conditions, though we use 11 years of observations of the SonotaCo network (SonotaCo, 2009). It is necessary to use other indexes to express the shower activity profiles; Koseki (2019b) proposes to use the radiant density ratios; DR3 is the density ratio within a circle of 3 degrees radius relative to a ring of 3–6 degrees; DR10 is the density ratio within a circle of 3 degrees relative to a ring of 6–10 degrees; DR15 is the density ratio within a circle of 3 degrees relative to a ring of 10–15 degrees. It is better to use the sliding mean of the radiant density ratios within bins of 3 degrees in λʘ in order to avoid too low meteor numbers in the reference areas. Which index is the best is different case by case, explained in the next sections.
3 Results
We get possible candidate meteors within 3 degrees from the estimated radiant point after several iterations (Table 3) and we can estimate their radiant shift (Figure 1). We can calculate the changes of the orbital elements also and we will show in detail the results in the following sections.

Figure 1 – Radiant shift of three “Virginids” in equatorial coordinates. Each small circles indicate the radiant point of every λʘ between the estimated range (Tables 4 to 6); the start and the end values for λʘ are shown in the figure.
Table 3 – Total number of radiants within 3 degrees from the estimated center.
| Year | 2007 | 2008 | 2009 | 2010 | 2011 | 2012 | 2013 | 2014 | 2015 | 2016 | 2017 | 2018 | Total |
| EVI#0011-02 | 3 | 0 | 45 | 16 | 2 | 2 | 24 | 15 | 1 | 5 | 37 | 11 | 161 |
| AVB#0021-04 | 1 | 5 | 9 | 2 | 9 | 3 | 7 | 11 | 5 | 6 | 13 | 10 | 81 |
| HVI#0343-03 | 0 | 13 | 14 | 0 | 0 | 0 | 1 | 4 | 7 | 1 | 2 | 0 | 42 |
3.1 EVI#0011
Whipple (1954) recorded four “Virginids” meteors by photographic observations (Table 4). These are members of the present EVI#0011 shower as shown in Table 4 and Figure 2. The author pointed out that McCrosky and Posen looked over Whipple’s “Virginids” (Figure 2a in Koseki, 2019b). The sporadic activity and the periodicity of EVI may explain why they did not notice these.

Figure 2 – The radiant distribution around the estimated EVI#0011 center; The y-axis runs through the ecliptic longitude of λ−λʘ and the scale is in degrees. Two circles represent the distance of 3 degrees and 6 degrees from the center. Four small circles indicate Whipple’s “Virginids”.

Figure 3 – Activity profile of the EVI#0011, see section 2.2 for the explanation of Nr <= 3, DR3, DR10, DR15.
Table 4 – Whipple’s “Virginids” (Whipple, 1954); (λΠ, βΠ) are the ecliptic coordinates of the perihelion.
| Code | Year | λʘ | α | δ | λ–λʘ | β | vg | e | q | i | ω | Ω | λΠ | βΠ | a |
| H5-2905 | 1951 | 344.7 | 176.2 | 5.1 | 189.8 | 3.2 | 29 | 0.843 | 0.381 | 3.6 | 290.2 | 344.7 | 274.9 | –3.4 | 2.43 |
| H5-1934 | 1950 | 357.9 | 188.9 | 1.6 | 189.7 | 5 | 29.2 | 0.848 | 0.384 | 5.9 | 289.8 | 357.9 | 287.8 | –5.6 | 2.53 |
| H5-828 | 1939 | 359.5 | 183.5 | 5.7 | 181.5 | 6.7 | 31 | 0.998 | 0.484 | 7.1 | 271.9 | 359.5 | 271.4 | –7.1 | 2.42 |
| H5-1158 | 1942 | 0.7 | 186.6 | 3.7 | 183.9 | 6.1 | 28.4 | 0.881 | 0.471 | 6.1 | 277.3 | 0.7 | 278 | –6.1 | 3.96 |
Shiba (2018) pointed at a four-year periodicity of the EVI activity and Table 3 confirmed his conclusion. He suggested that EVI is in a 3:1 resonance with Jupiter Table 5 shows the additional evidence for his point; the orientation of the perihelion (λΠ, βΠ) and the semi major axis a are almost constant.
Table 5 – The estimated data of the EVI resulting from the regression; (λΠ, βΠ) are the ecliptic coordinates of the perihelion.
| λʘ | λ–λʘ | β | α | δ | vg | e | q | i | ω | Ω | λΠ | βΠ | a |
| 345 | 192.8 | 4.3 | 179.7 | 4.8 | 30.1 | 0.85 | 0.331 | 5.5 | 296.8 | 345 | 281.9 | -4.9 | 2.21 |
| 346 | 192.3 | 4.3 | 180.1 | 4.7 | 29.9 | 0.847 | 0.34 | 5.5 | 295.6 | 346 | 281.7 | -4.9 | 2.23 |
| 347 | 191.7 | 4.4 | 180.6 | 4.6 | 29.6 | 0.844 | 0.35 | 5.4 | 294.4 | 347 | 281.5 | -4.9 | 2.25 |
| 348 | 191.2 | 4.5 | 181.1 | 4.4 | 29.4 | 0.841 | 0.36 | 5.4 | 293.3 | 348 | 281.4 | -5 | 2.27 |
| 349 | 190.7 | 4.6 | 181.6 | 4.3 | 29.1 | 0.839 | 0.369 | 5.4 | 292.1 | 349 | 281.2 | -5 | 2.29 |
| 350 | 190.2 | 4.6 | 182 | 4.2 | 28.9 | 0.836 | 0.379 | 5.4 | 291 | 350 | 281.1 | -5 | 2.31 |
| 351 | 189.7 | 4.7 | 182.5 | 4.1 | 28.6 | 0.833 | 0.389 | 5.3 | 289.8 | 351 | 280.9 | -5 | 2.33 |
| 352 | 189.2 | 4.8 | 183 | 3.9 | 28.3 | 0.83 | 0.398 | 5.3 | 288.7 | 352 | 280.8 | -5 | 2.35 |
| 353 | 188.7 | 4.9 | 183.4 | 3.8 | 28.1 | 0.828 | 0.408 | 5.3 | 287.6 | 353 | 280.6 | -5 | 2.37 |
| 354 | 188.1 | 4.9 | 183.9 | 3.7 | 27.8 | 0.825 | 0.418 | 5.2 | 286.4 | 354 | 280.5 | -5 | 2.38 |
| 355 | 187.6 | 5 | 184.4 | 3.5 | 27.6 | 0.822 | 0.427 | 5.2 | 285.3 | 355 | 280.4 | -5 | 2.4 |
| 356 | 187.1 | 5.1 | 184.9 | 3.4 | 27.3 | 0.819 | 0.437 | 5.2 | 284.2 | 356 | 280.2 | -5 | 2.42 |
| 357 | 186.6 | 5.1 | 185.3 | 3.3 | 27 | 0.817 | 0.447 | 5.2 | 283.1 | 357 | 280.1 | -5 | 2.44 |
| 358 | 186.1 | 5.2 | 185.8 | 3.2 | 26.8 | 0.814 | 0.456 | 5.1 | 281.9 | 358 | 280 | -5 | 2.45 |
| 359 | 185.5 | 5.3 | 186.3 | 3 | 26.5 | 0.811 | 0.466 | 5.1 | 280.8 | 359 | 279.9 | -5 | 2.47 |
| 0 | 185 | 5.4 | 186.7 | 2.9 | 26.3 | 0.808 | 0.476 | 5.1 | 279.7 | 0 | 279.8 | -5 | 2.48 |
| 1 | 184.5 | 5.4 | 187.2 | 2.8 | 26 | 0.806 | 0.485 | 5 | 278.6 | 1 | 279.7 | -5 | 2.49 |
| 2 | 184 | 5.5 | 187.7 | 2.7 | 25.8 | 0.803 | 0.495 | 5 | 277.5 | 2 | 279.6 | -5 | 2.51 |
| 3 | 183.5 | 5.6 | 188.1 | 2.5 | 25.5 | 0.8 | 0.504 | 5 | 276.4 | 3 | 279.5 | -4.9 | 2.52 |
| 4 | 183 | 5.6 | 188.6 | 2.4 | 25.2 | 0.797 | 0.513 | 4.9 | 275.4 | 4 | 279.4 | -4.9 | 2.53 |
| 5 | 182.4 | 5.7 | 189.1 | 2.3 | 25 | 0.794 | 0.523 | 4.9 | 274.3 | 5 | 279.3 | -4.9 | 2.54 |
We note that the radiant distribution of EVI is still elongated after the regression analysis (Figure 2) although the radiant distribution usually would be round after the process (see Figure 5 and 10). We selected candidate EVI meteors in the time bin of 356° <= λʘ < 358° and within 3 degrees from the estimated radiant in (λ−λʘ, β). It becomes clear that the geocentric velocity changes with the x-axis in Figure 2 and, therefore, we can calculate the difference in orbital elements between the left and right edges of the elongated radiant distribution.
It is clear that the elongated form is caused by the dispersion/rotation in the orientation of the perihelion though the semi major axis is kept constant (Table 6).

Figure 4 – Comparison between the Nr <= 3° profile of EVI#0011 and the estimation of the activity as calculated from the orbit (Koseki, 2012); Nr <= 3° is counted for each 0.1 degree bin of λʘ and displayed here with a sliding mean of a 1 degree bin in λʘ.
Table 6 – The difference between the orbital elements of the east (left) and west (right) edges for EVI#0011.
| x | y | λʘ | λ–λʘ | β | α | δ | vg | e | q | i | ω | Ω | λΠ | βΠ | a |
| –5 | –0.2 | 357 | 190.9 | 5.3 | 189.3 | 1.7 | 29.6 | 0.848 | 0.364 | 6.4 | 292.5 | 357 | 289.6 | –5.9 | 2.39 |
| 5 | 0.43 | 357 | 180.8 | 5.9 | 180.4 | 6.3 | 23.8 | 0.774 | 0.555 | 4.7 | 270.8 | 357 | 267.8 | –4.7 | 2.46 |
AVB#0021
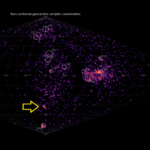
Jenniskens et al. (2016) insists that the AVB#0021-04 are “α-Virginids” but the author showed that these observations are a newly discovered meteor shower (Figure 4a of Koseki, 2019a). This activity is weak but the radiant distribution shows enough concentration (Figure 5). The DR curves in Figure 6 suggest that the activity peaks around λʘ = 30° though the raw recorded number (Nr <= 3) fluctuates largely (Figures 6 and 7).

Figure 5 – The radiant distribution around the estimated AVB#0021 center.

Figure 6 – Activity profile of AVB#0021.

Figure 7 – Comparison between the Nr <= 3° profile of AVB#0021 with the estimation of the activity.
Table 7 shows the semi major axis a changes a little bit but its orientation rotates with the activity period. This means AVB (it is better to call it σ-Virginids though, see Figure 1) is a typical ANT activity; its radiant shifts eastward with time (Figure 1).
Table 7 – The estimated data of AVB resulting from the regression; (λΠ, βΠ) are the ecliptic coordinates of the perihelion.
| λʘ | λ–λʘ | β | α | δ | vg | e | q | i | ω | Ω | λΠ | βΠ | a |
| 15 | 176.2 | 9.6 | 194.1 | 4.4 | 21.2 | 0.729 | 0.642 | 6.5 | 261.4 | 15 | 276.3 | –6.4 | 2.37 |
| 16 | 175.8 | 9.8 | 194.6 | 4.4 | 21.1 | 0.728 | 0.649 | 6.5 | 260.5 | 16 | 276.4 | –6.4 | 2.39 |
| 17 | 175.3 | 10 | 195.2 | 4.3 | 20.9 | 0.728 | 0.655 | 6.6 | 259.6 | 17 | 276.6 | –6.5 | 2.41 |
| 18 | 174.9 | 10.2 | 195.8 | 4.3 | 20.8 | 0.727 | 0.662 | 6.6 | 258.8 | 18 | 276.7 | –6.5 | 2.42 |
| 19 | 174.4 | 10.4 | 196.4 | 4.3 | 20.6 | 0.727 | 0.668 | 6.7 | 257.9 | 19 | 276.8 | –6.5 | 2.44 |
| 20 | 174 | 10.5 | 196.9 | 4.2 | 20.5 | 0.726 | 0.675 | 6.7 | 257.1 | 20 | 277 | –6.5 | 2.46 |
| 21 | 173.5 | 10.7 | 197.5 | 4.2 | 20.3 | 0.725 | 0.681 | 6.7 | 256.2 | 21 | 277.1 | –6.6 | 2.48 |
| 22 | 173.1 | 10.9 | 198.1 | 4.1 | 20.2 | 0.725 | 0.687 | 6.8 | 255.4 | 22 | 277.3 | –6.6 | 2.5 |
| 23 | 172.6 | 11.1 | 198.6 | 4.1 | 20 | 0.724 | 0.694 | 6.8 | 254.6 | 23 | 277.5 | –6.6 | 2.51 |
| 24 | 172.1 | 11.3 | 199.2 | 4.1 | 19.9 | 0.724 | 0.7 | 6.9 | 253.8 | 24 | 277.6 | –6.6 | 2.53 |
| 25 | 171.7 | 11.5 | 199.8 | 4 | 19.7 | 0.723 | 0.706 | 6.9 | 252.9 | 25 | 277.8 | –6.6 | 2.55 |
| 26 | 171.2 | 11.7 | 200.3 | 4 | 19.6 | 0.722 | 0.712 | 6.9 | 252.1 | 26 | 278 | –6.6 | 2.56 |
| 27 | 170.8 | 11.8 | 200.9 | 4 | 19.4 | 0.722 | 0.718 | 6.9 | 251.3 | 27 | 278.2 | –6.6 | 2.58 |
| 28 | 170.3 | 12 | 201.4 | 3.9 | 19.3 | 0.721 | 0.724 | 7 | 250.5 | 28 | 278.4 | –6.6 | 2.59 |
| 29 | 169.9 | 12.2 | 202 | 3.9 | 19.2 | 0.72 | 0.729 | 7 | 249.7 | 29 | 278.6 | –6.6 | 2.61 |
| 30 | 169.4 | 12.4 | 202.6 | 3.9 | 19 | 0.719 | 0.735 | 7 | 249 | 30 | 278.8 | –6.6 | 2.62 |
| 31 | 168.9 | 12.6 | 203.1 | 3.8 | 18.9 | 0.718 | 0.741 | 7 | 248.2 | 31 | 279 | –6.5 | 2.63 |
| 32 | 168.5 | 12.7 | 203.7 | 3.8 | 18.7 | 0.718 | 0.746 | 7.1 | 247.4 | 32 | 279.3 | –6.5 | 2.64 |
| 33 | 168 | 12.9 | 204.2 | 3.8 | 18.6 | 0.717 | 0.752 | 7.1 | 246.7 | 33 | 279.5 | –6.5 | 2.65 |
| 34 | 167.5 | 13.1 | 204.8 | 3.8 | 18.4 | 0.716 | 0.757 | 7.1 | 245.9 | 34 | 279.7 | –6.5 | 2.66 |
| 35 | 167.1 | 13.3 | 205.3 | 3.7 | 18.3 | 0.715 | 0.763 | 7.1 | 245.2 | 35 | 280 | –6.5 | 2.67 |
| 36 | 166.6 | 13.4 | 205.9 | 3.7 | 18.1 | 0.714 | 0.768 | 7.1 | 244.4 | 36 | 280.3 | –6.4 | 2.68 |
| 37 | 166.2 | 13.6 | 206.4 | 3.7 | 18 | 0.713 | 0.773 | 7.1 | 243.7 | 37 | 280.5 | –6.4 | 2.69 |
| 38 | 165.7 | 13.8 | 207 | 3.6 | 17.8 | 0.711 | 0.779 | 7.2 | 243 | 38 | 280.8 | –6.4 | 2.7 |
| 39 | 165.2 | 14 | 207.5 | 3.6 | 17.7 | 0.71 | 0.784 | 7.2 | 242.2 | 39 | 281.1 | –6.3 | 2.7 |
| 40 | 164.8 | 14.1 | 208.1 | 3.6 | 17.6 | 0.709 | 0.789 | 7.2 | 241.5 | 40 | 281.3 | –6.3 | 2.71 |
HVI#0343
HVI#0343 was first reported by SonotaCo (2009) and it was a very fortunate case, because the activity of HVI fluctuates a lot (Table 3) and their first observation coincides with its active year 2008. The discovery report was based on the observations 2007–2008.
Figure 10 clearly shows that the radiant of HVI is very compact; it is very different from the EVI case (Figure 2). HVI has a very sharp maximum around λʘ = 41° (Figures 8 and 9) though our results are based mainly on 2008 and 2009 observations (Table 3).
Table 8 shows that the shape of the orbit and the orientation of the perihelion of HVI is stable. It confirms HVI is in resonance with Jupiter (Shiba’s view; cited by Roggemans et al. 2020). Sekiguchi (http://sonotaco.jp/forum/viewtopic.php?t=4580) gives 2020 observations of HVI by SonotaCo net (Roggemans et al., 2020) and his reported 27 HVI meteor are added in Figure 11 as circles.
We know now that the HVI radiant shifts slowly in (α, δ) (Figure 1) but rapidly on (λ−λʘ, β), and the HVI peak is very sharp as shown in Figures 8 and 9. It was suggested that HVI is the rediscovery of the “α-Virginids” (Koseki, 2019a) but this assumption might be rejected. Figure 12 shows the Harvard “α-Virginids” distribution as circles but located apart from the center and observed much later than the HVI maximum shown in Figure 9 (Table 4a of Koseki, 2019a).

Figure 8 – Activity profile of HVI#0343.

Figure 9 – Comparison of Nr <= 3° profile of HVI#0343 with the estimation of the activity.

Figure 10 – The radiant distribution around the estimated HVI#0343 center.

Figure 11 – 2020 HVI observations (circles) with 2007–2018 observations.

Figure 12 – Harvard photographic “α-Virginids” (circles) with 2007–2018 video observations.
Table 8 – The estimated data of HVI resulting from the regression; (λΠ, βΠ) are the ecliptic coordinates of the perihelion.
| λʘ | λ–λʘ | β | α | δ | vg | e | q | i | ω | Ω | λΠ | βΠ | a |
| 30 | 173.3 | -0.8 | 201.2 | –9.8 | 20.2 | 0.73 | 0.675 | 0.5 | 77.2 | 210 | 287.2 | 0.5 | 2.5 |
| 31 | 172.5 | -0.9 | 201.5 | –10 | 20 | 0.729 | 0.685 | 0.5 | 75.9 | 211 | 286.9 | 0.5 | 2.53 |
| 32 | 171.8 | -0.9 | 201.7 | –10.1 | 19.8 | 0.729 | 0.694 | 0.6 | 74.6 | 212 | 286.6 | 0.5 | 2.56 |
| 33 | 171.1 | -1 | 201.9 | –10.3 | 19.5 | 0.728 | 0.704 | 0.6 | 73.2 | 213 | 286.2 | 0.6 | 2.59 |
| 34 | 170.3 | -1 | 202.1 | –10.4 | 19.3 | 0.727 | 0.713 | 0.6 | 72 | 214 | 286 | 0.6 | 2.61 |
| 35 | 169.6 | -1.1 | 202.4 | –10.5 | 19 | 0.726 | 0.723 | 0.6 | 70.7 | 215 | 285.7 | 0.6 | 2.64 |
| 36 | 168.8 | -1.2 | 202.6 | –10.7 | 18.8 | 0.725 | 0.732 | 0.7 | 69.5 | 216 | 285.5 | 0.6 | 2.66 |
| 37 | 168.1 | -1.2 | 202.8 | –10.8 | 18.6 | 0.724 | 0.741 | 0.7 | 68.2 | 217 | 285.2 | 0.6 | 2.68 |
| 38 | 167.4 | -1.3 | 203 | –11 | 18.3 | 0.722 | 0.749 | 0.7 | 67 | 218 | 285 | 0.6 | 2.7 |
| 39 | 166.6 | -1.3 | 203.3 | –11.1 | 18.1 | 0.721 | 0.758 | 0.7 | 65.8 | 219 | 284.8 | 0.6 | 2.72 |
| 40 | 165.9 | -1.4 | 203.5 | –11.3 | 17.8 | 0.719 | 0.766 | 0.7 | 64.6 | 220 | 284.6 | 0.6 | 2.73 |
| 41 | 165.1 | -1.4 | 203.7 | –11.4 | 17.6 | 0.718 | 0.775 | 0.7 | 63.5 | 221 | 284.5 | 0.7 | 2.74 |
| 42 | 164.4 | -1.5 | 203.9 | –11.6 | 17.4 | 0.716 | 0.783 | 0.7 | 62.3 | 222 | 284.3 | 0.7 | 2.75 |
| 43 | 163.6 | -1.5 | 204.2 | –11.7 | 17.1 | 0.714 | 0.79 | 0.8 | 61.2 | 223 | 284.2 | 0.7 | 2.76 |
| 44 | 162.9 | -1.6 | 204.4 | –11.8 | 16.9 | 0.711 | 0.798 | 0.8 | 60.1 | 224 | 284.1 | 0.7 | 2.76 |
| 45 | 162.2 | -1.6 | 204.6 | –12 | 16.6 | 0.709 | 0.806 | 0.8 | 59 | 225 | 284 | 0.7 | 2.77 |
| 46 | 161.4 | -1.7 | 204.8 | –12.1 | 16.4 | 0.706 | 0.813 | 0.8 | 58 | 226 | 284 | 0.7 | 2.77 |
| 47 | 160.7 | -1.7 | 205.1 | –12.3 | 16.2 | 0.703 | 0.82 | 0.8 | 56.9 | 227 | 283.9 | 0.7 | 2.76 |
| 48 | 159.9 | -1.8 | 205.3 | –12.4 | 15.9 | 0.7 | 0.827 | 0.8 | 55.9 | 228 | 283.9 | 0.7 | 2.76 |
| 49 | 159.2 | -1.8 | 205.5 | –12.5 | 15.7 | 0.697 | 0.834 | 0.8 | 54.8 | 229 | 283.8 | 0.7 | 2.75 |
| 50 | 158.5 | -1.9 | 205.7 | –12.7 | 15.5 | 0.693 | 0.84 | 0.8 | 53.8 | 230 | 283.8 | 0.7 | 2.74 |
References
Dennning W. F. (1899). “General Catalogue of the Radiant Points of Meteoric Showers and of Fireballs and Shooting Stars observed at more than one station”. Memoirs of the Royal Astronomical Society, 53, 201–293.
Hoffmeister C. (1948). “Meteorströme”. Johann Ambrosius Bath, Verlag, Leipzig.
Jenniskens P. (2006), “Meteorshowers and Their Parent Comets”. Cambridge, UK: Cambridge University Press.
Jenniskens P., Nénon Q., Gural P. S., Albers J., Haberman B., Johnson B., Holman D., Morales R., Grigsby B. J., Samuels D., Johannink C. (2016). “CAMS confirmation of previously reported meteor showers”. Icarus, 266, 355–370.
Koseki M. (2012). “A simple model of spatial structure of meteoroid streams”. WGN, Journal of the International Meteor Organization, 40, 162–165.
Koseki M. (2019a). “Legendary meteor showers: Studies on Harvard photographic results”. WGN, Journal of the International Meteor Organization, 47, 139–150.
Koseki M. (2019b). “Profiles of meteor shower activities inferred from the radiant Density Ratios (DR)”. WGN, Journal of the International Meteor Organization, 47, 168–179.
McCrosky R. E. and Posen A. (1959). “New Photographic Meteor Shower”. Astronomical Journal,64, 25–27.
McIntosh R. A. (1935). “An Index to Southern Meteor Showers”. Monthly Notices of the Royal Astronomical Society, 95, 709–718.
Roggemans P., Johannink C. and Sekiguchi T. (2020). “h Virginids (HVI#343) activity enhancement in 2020”. eMetN, 5, 233–244.
Shiba Y. (2018). “Eta Virginids (EVI) four-year cycle”. WGN, Journal of the International Meteor Organization, 46, 184–190.
SonotaCo (2009). “A meteor shower catalog based on video observations in 2007–2008”. WGN, Journal of the International Meteor Organization, 37, 55–62.
Whipple Fred L. (1954). “Photographic meteor orbits and their distribution in space”. Astronomical Journal, 59, 201–217.

Nice!