An overview of the radio observations during April 2019 is given.
The graphs show both the daily totals (Figure 1) and the hourly numbers (Figure 2) of “all” reflections counted automatically, and of manually counted “overdense” reflections, overdense reflections longer than 10 seconds and longer than 1 minute, as observed here at Kampenhout (BE) on the frequency of our VVS-beacon (49.99 MHz) during the month of April 2019.
The hourly numbers, for echoes shorter than 1 minute, are weighted averages derived from:
N(h) = n(h-1)/4 + n(h)/2 + n(h+1)/4
Unfortunately, due to technical problems, data were lost on April 1st and partially on April 2nd (see Figures 1 and 2). During this month there were some local disturbances and interference, but no registered “sporadic E” (Es). Lightning activity was noted on 3 days (2+3+7th of April).
As expected the Lyrids shower peaked on April 23rd, which is readily shown by the graphs of reflections longer than 10 seconds.
If you are interested in the actual figures, please send me an e-mail: felix.verbelen at skynet.be.

Figure 1 – The daily totals of “all” reflections counted automatically, and of manually counted “overdense” reflections, overdense reflections longer than 10 seconds and longer than 1 minute, as observed here at Kampenhout (BE) on the frequency of our VVS-beacon (49.99 MHz) during April 2019.

Figure 2 – The hourly numbers of “all” reflections counted automatically, and of manually counted “overdense” reflections, overdense reflections longer than 10 seconds and longer than 1 minute, as observed here at Kampenhout (BE) on the frequency of our VVS-beacon (49.99 MHz) during April 2019.

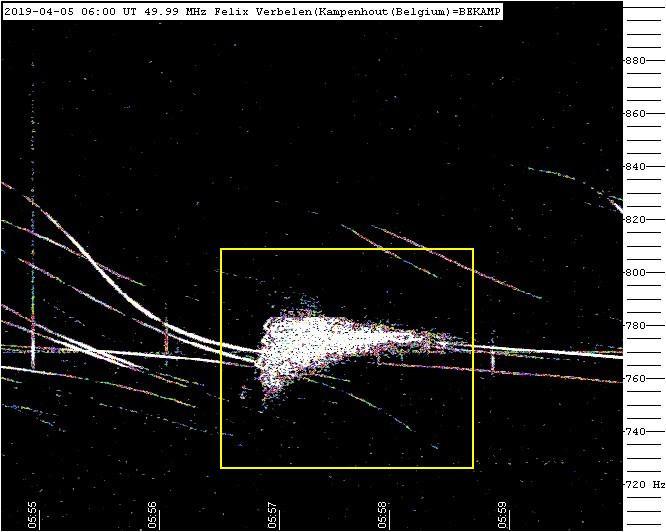
Figure 3 – Echo registered on 5 April 2019 at 06h00m UT.


