An overview of the radio observations during March 2019 is given.
The graphs show both the daily totals (Figure 1) and the hourly numbers (Figure 2) of “all” reflections counted automatically, and of manually counted “overdense” reflections, overdense reflections longer than 10 seconds and longer than 1 minute, as observed here at Kampenhout (BE) on the frequency of our VVS-beacon (49.99 MHz) during the month of March 2019.
The hourly numbers, for echoes shorter than 1 minute, are weighted averages derived from:
N(h) = n(h-1)/4 + n(h)/2 + n(h+1)/4
Unfortunately data are missing for several days, due to technical problems (see Figures 1 and 2).
During this month there were few local disturbances and no registered “sporadic E” (Es), but lightning activity was noted on 5 days (7+10+11+13+17th of March).
As expected the meteor activity was fairly low, but nevertheless a number of nice smaller meteor showers (to be analysed in detail).
If you are interested in the actual figures, please send me an e-mail: felix.verbelen at skynet.be.

Figure 1 – The daily totals of “all” reflections counted automatically, and of manually counted “overdense” reflections, overdense reflections longer than 10 seconds and longer than 1 minute, as observed here at Kampenhout (BE) on the frequency of our VVS-beacon (49.99 MHz) during March 2019.

Figure 2 – The hourly numbers of “all” reflections counted automatically, and of manually counted “overdense” reflections, overdense reflections longer than 10 seconds and longer than 1 minute, as observed here at Kampenhout (BE) on the frequency of our VVS-beacon (49.99 MHz) during March 2019.

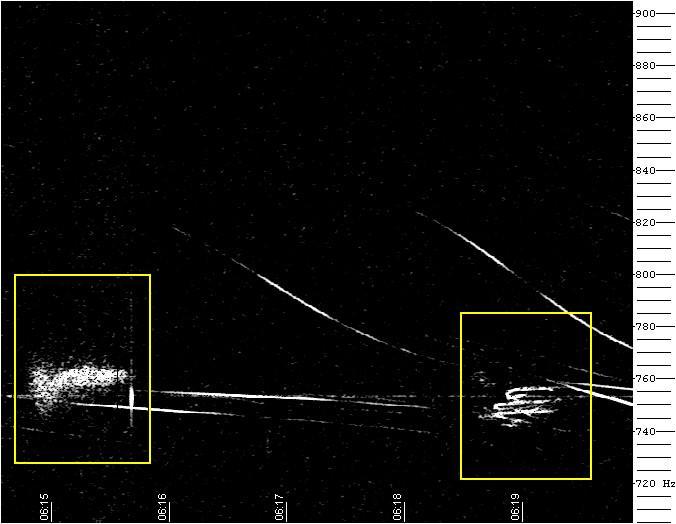
Figure 3 – 4 March 2019, 04h00m UT.

Figure 4 – 4 March 2019, 06h20m UT.

Figure 5 – 4 March 2019, 06h25m UT.

Figure 6 – 6 March 2019, 06h30m UT.

