Abstract: An overview of the radio observations during February 2024 is given.
The graphs show both the daily totals (Figure 1) and the hourly numbers (Figure 2) of “all” reflections counted automatically, and of manually counted “overdense” reflections, overdense reflections longer than 10 seconds and longer than 1 minute, as observed here at Kampenhout (BE) on the frequency of our VVS-beacon (49.99 MHz) during the month of February 2024.
The hourly numbers, for echoes shorter than 1 minute, are weighted averages derived from:

Local interference and unidentified noise remained low for most of the month, but almost daily several strong solar outbursts made the observations even more interesting. Figure 3 is an example of a strong outburst on February 9th.
Quite strong lightning activity occurred on February 22th and faint activity on the 18th and the 23rd.
Only minor meteor showers were observed this month, and the numbers of reflections remained very low as expected at this time of the year.
Quite a number of the reflections appeared in fairly dense groups (Figures 4 to 10). Taking into account the time intervals between the members of the groups, it is obvious that the possible fragmentation didn’t occur in the Earth’s atmosphere but must have taken place earlier. It would be interesting to further investigate this.
Over the entire month, 6 reflections longer than 1 minute were recorded. A selection of these, along with some other interesting reflections is included (Figures 11 to 16). More of these are available on request.
In addition to the usual graphs, you will also find the raw counts (subject to strict reservations as previously said) in cvs-format from which the graphs are derived. The table contains the following columns: day of the month, hour of the day, day + decimals, solar longitude (epoch J2000), counts of “all” reflections, overdense reflections, reflections longer than 10 seconds and reflections longer than 1 minute, the numbers being the observed reflections of the past hour.
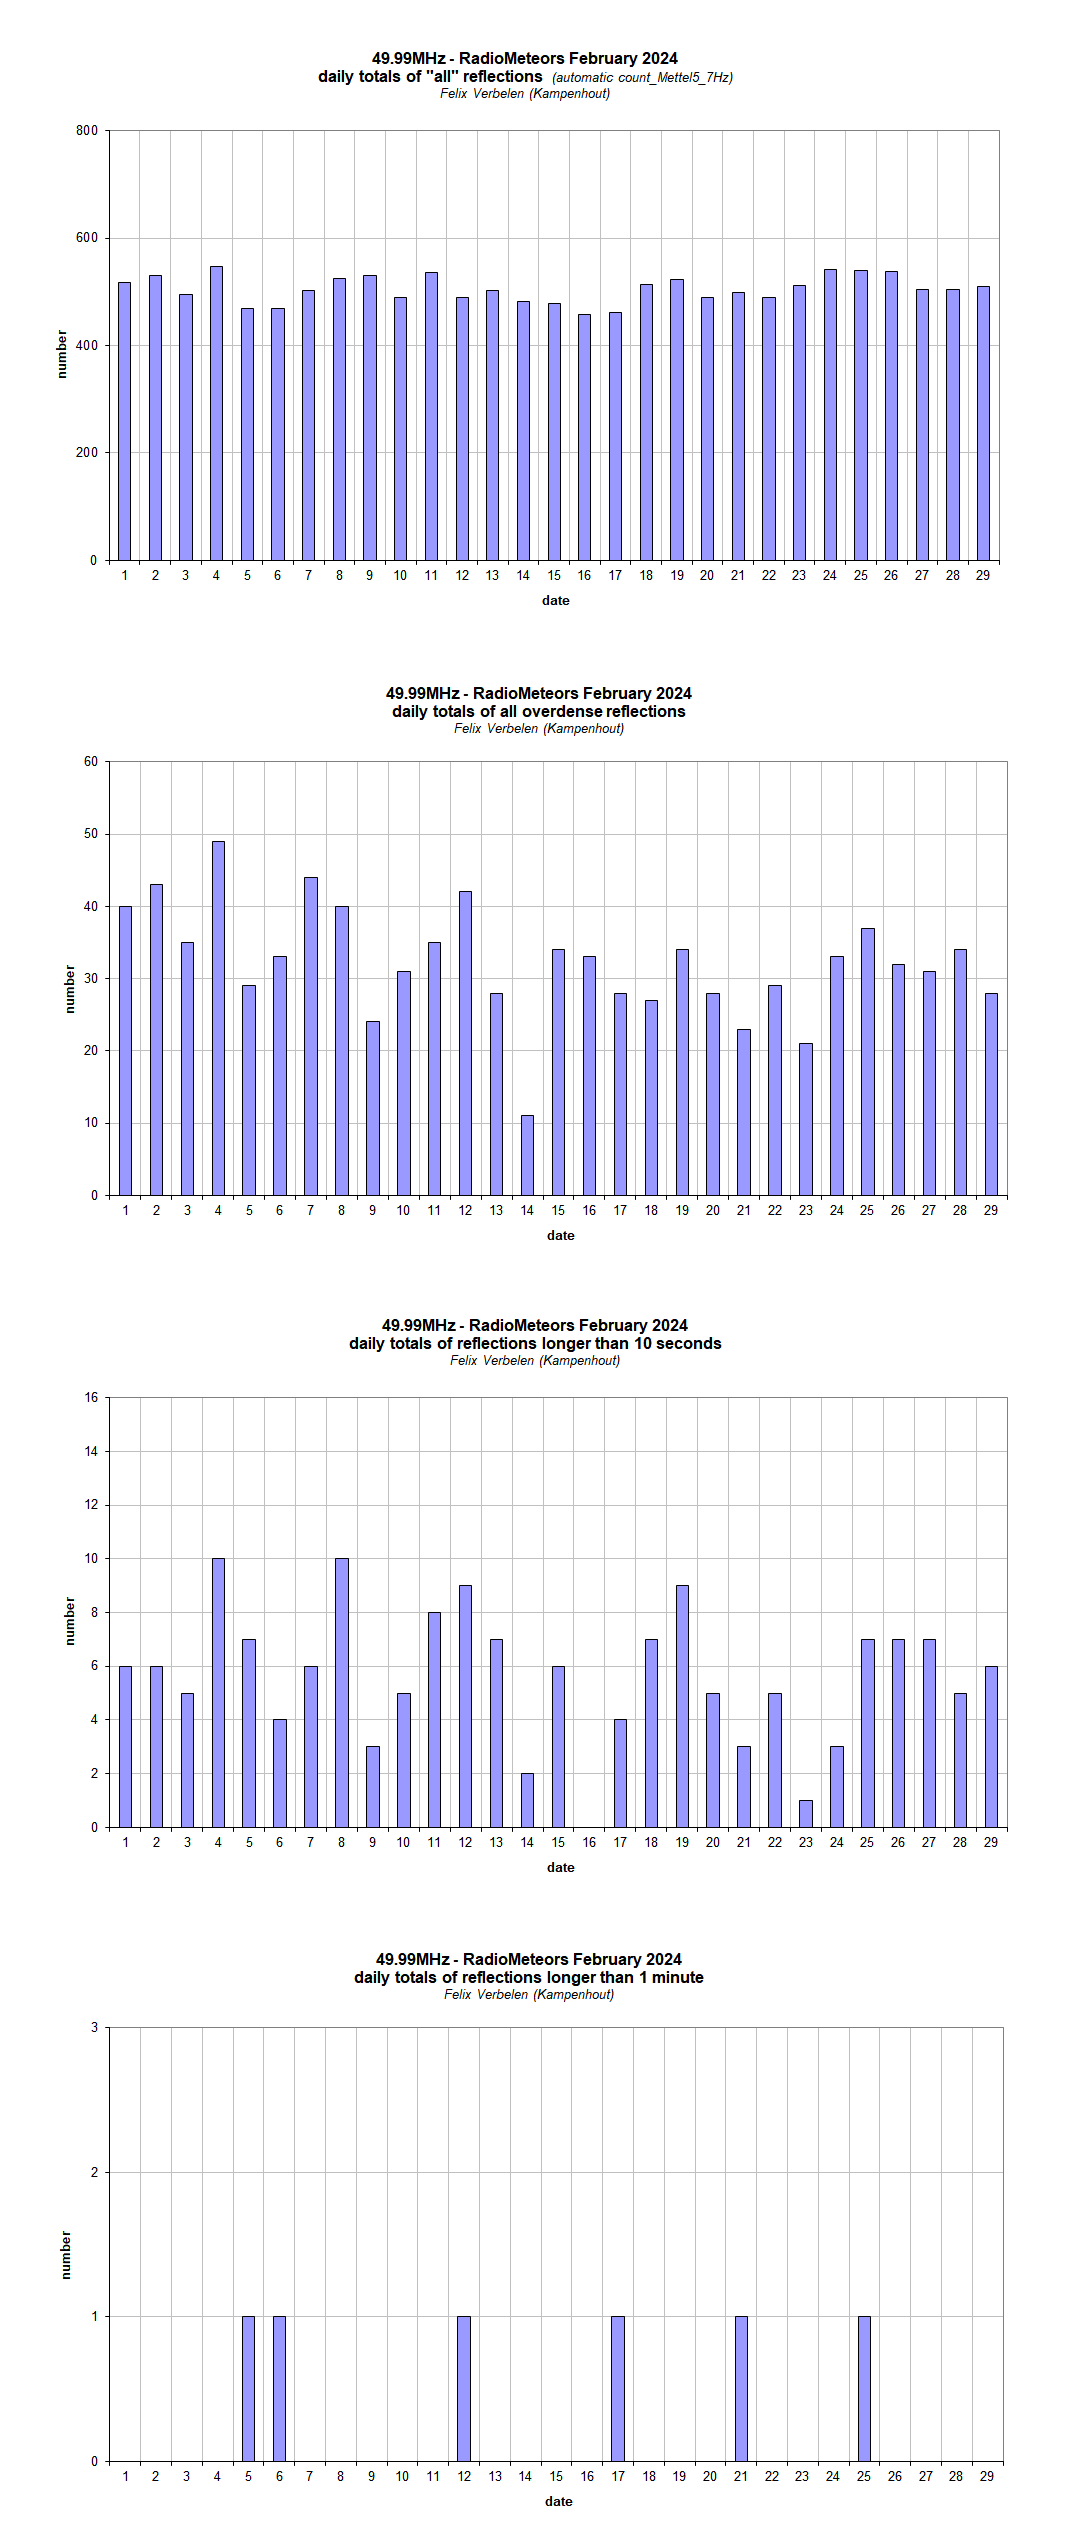
Figure 1 – The daily totals of “all” reflections counted automatically, and of manually counted “overdense” reflections, as observed here at Kampenhout (BE) on the frequency of our VVS-beacon (49.99 MHz) during February 2024.
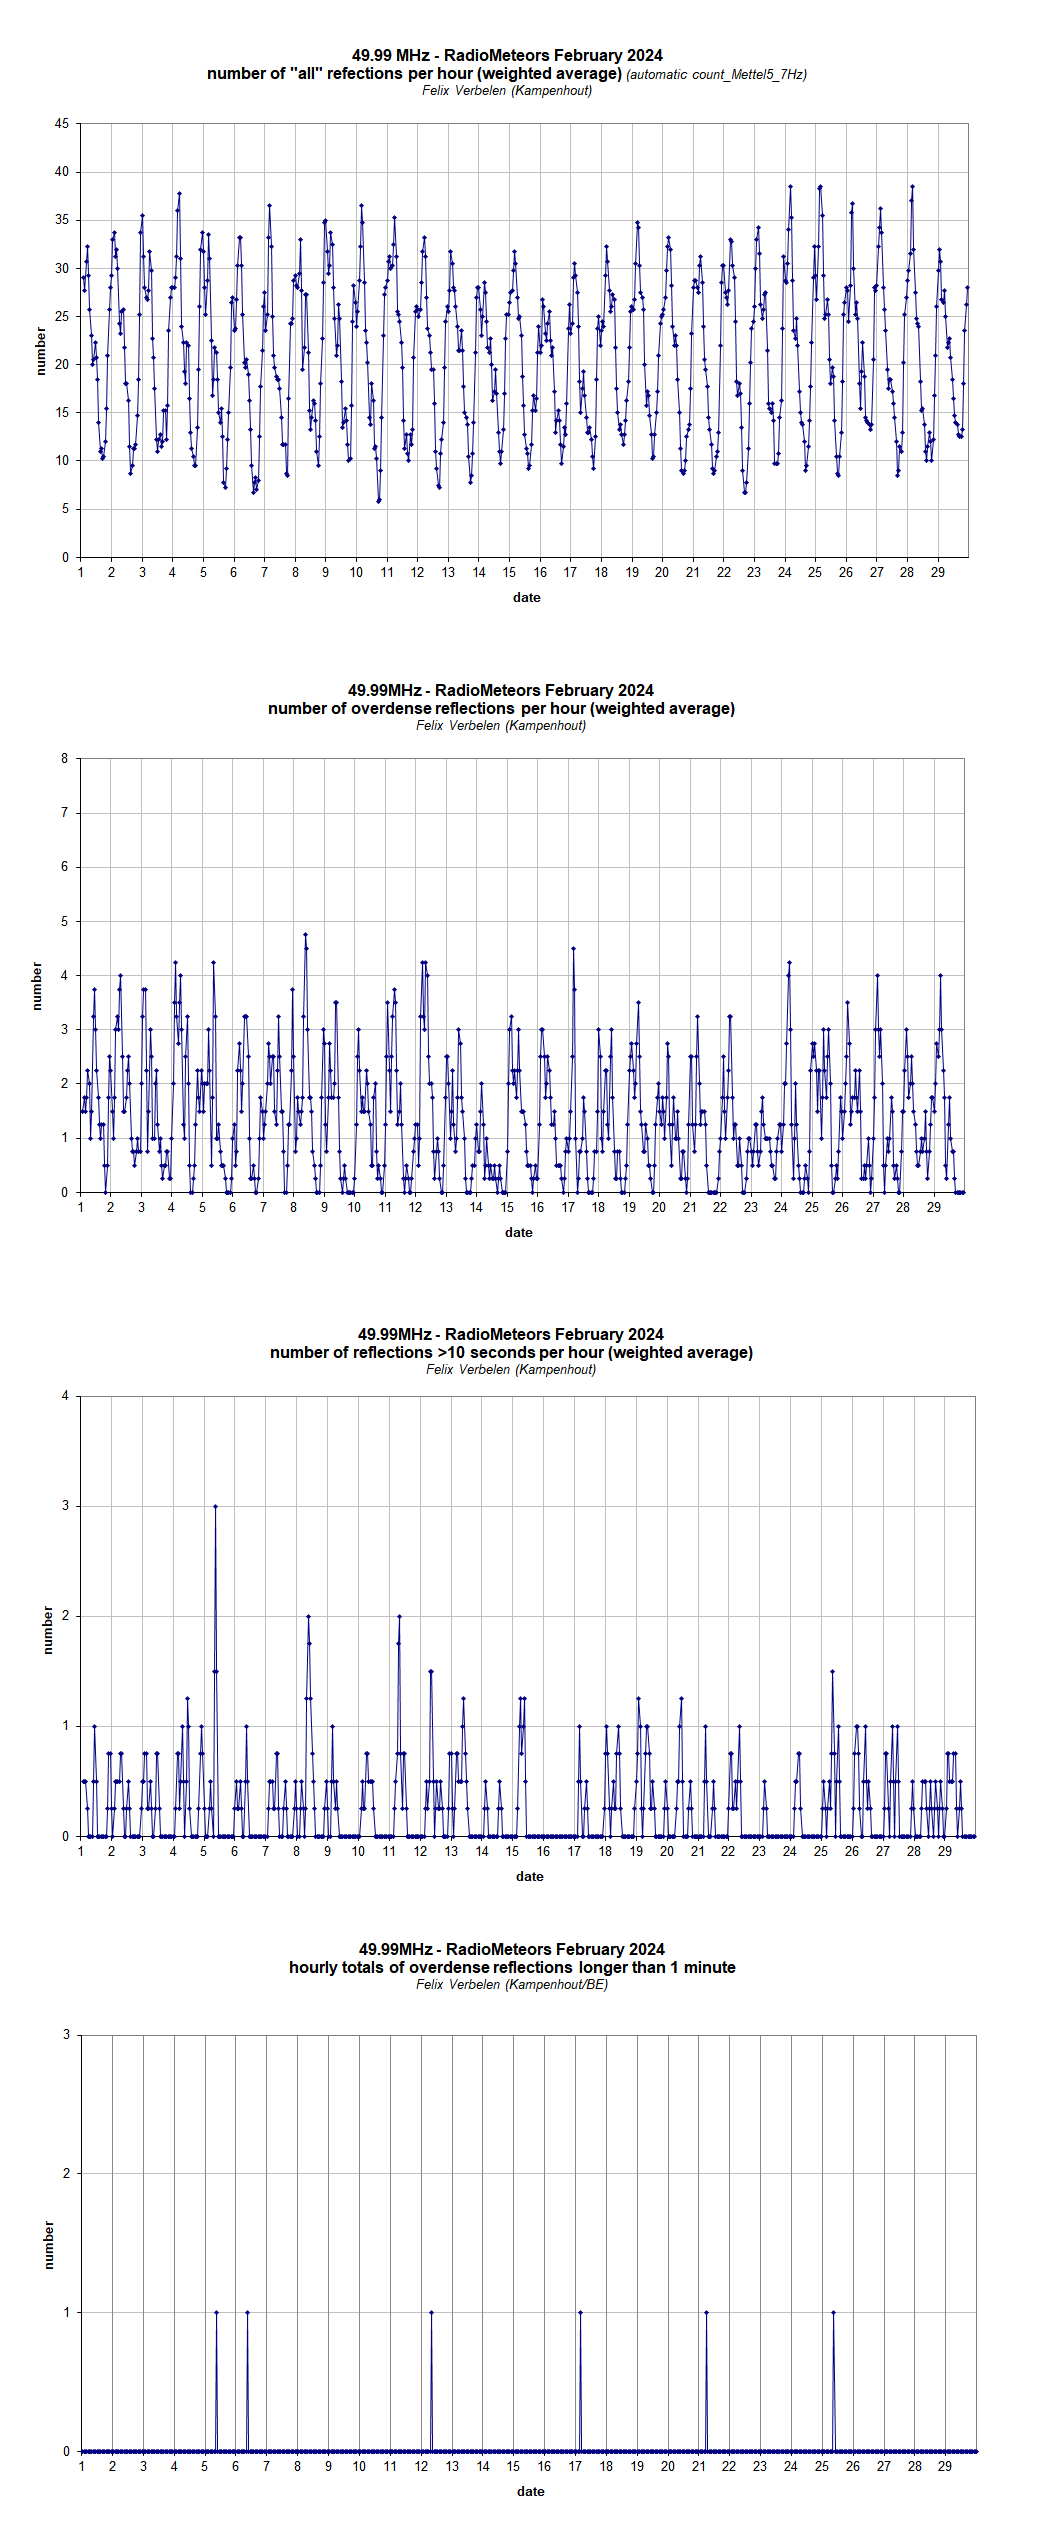
Figure 2 – The hourly numbers of “all” reflections counted automatically, and of manually counted “overdense” reflections, overdense reflections longer than 10 seconds and longer than 1 minute, as observed here at Kampenhout (BE) on the frequency of our VVS-beacon (49.99 MHz) during February 2024.
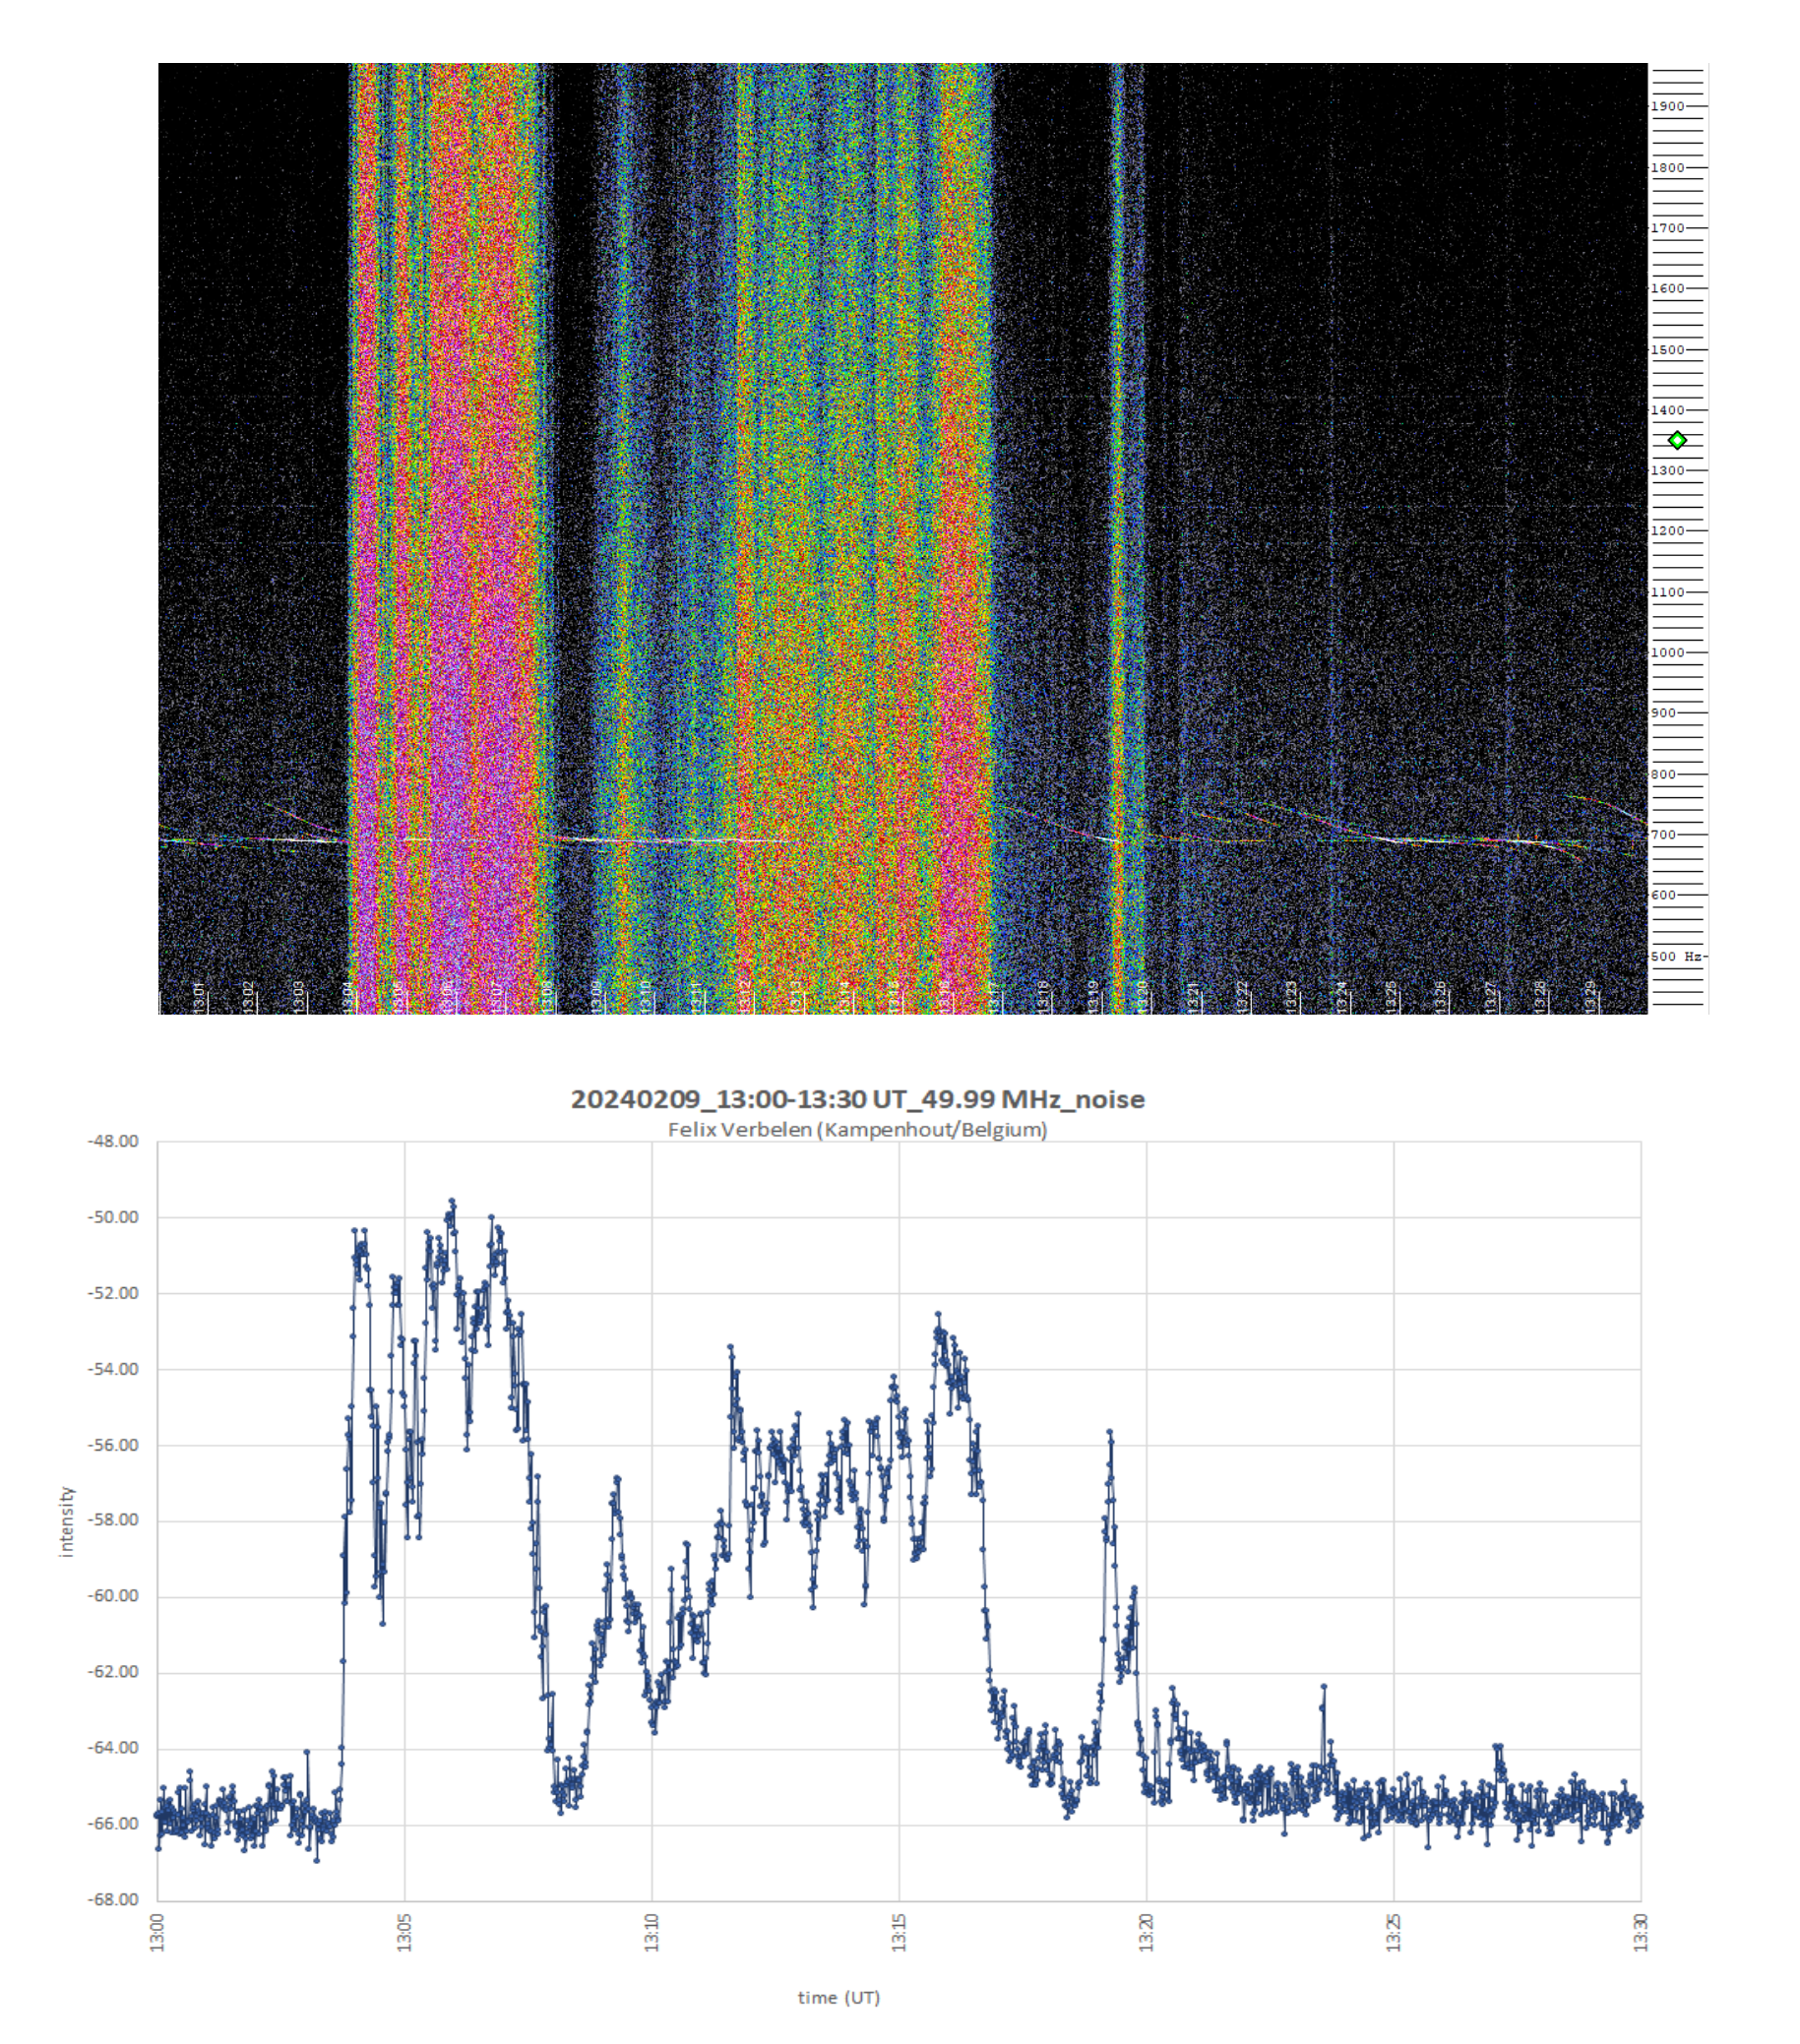
Figure 3 – Strong solar outbursts on February 9th.
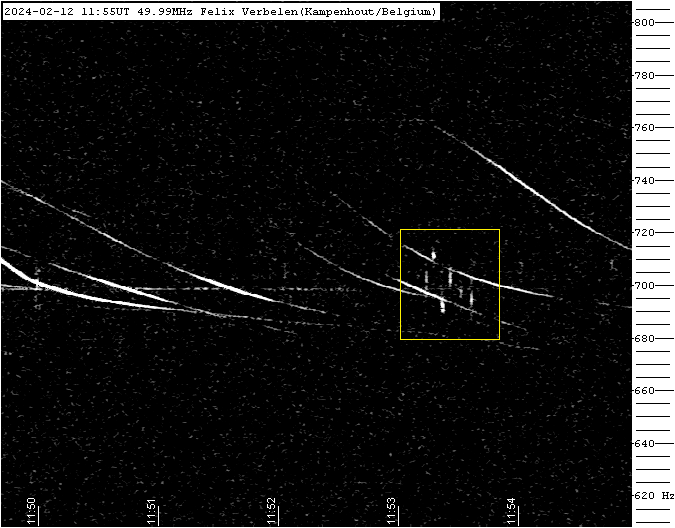
Figure 4 – Meteor echoes February 12, 11h55m UT.
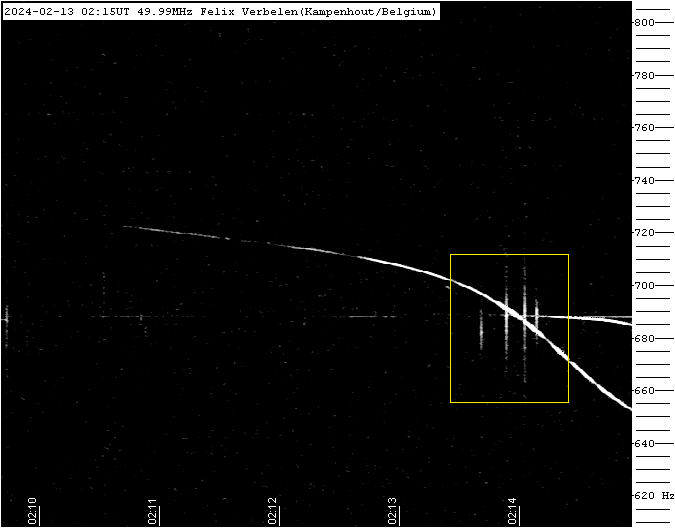
Figure 5 – Meteor echoes February 13, 2h15m UT.
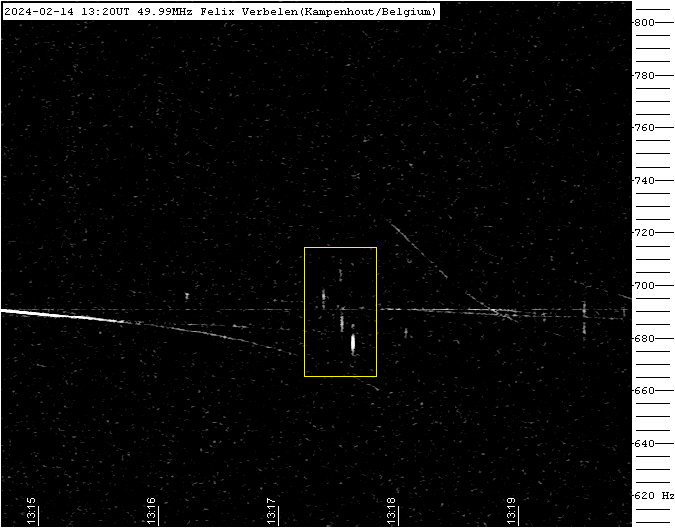
Figure 6 – Meteor echoes February 14, 13h20m UT.
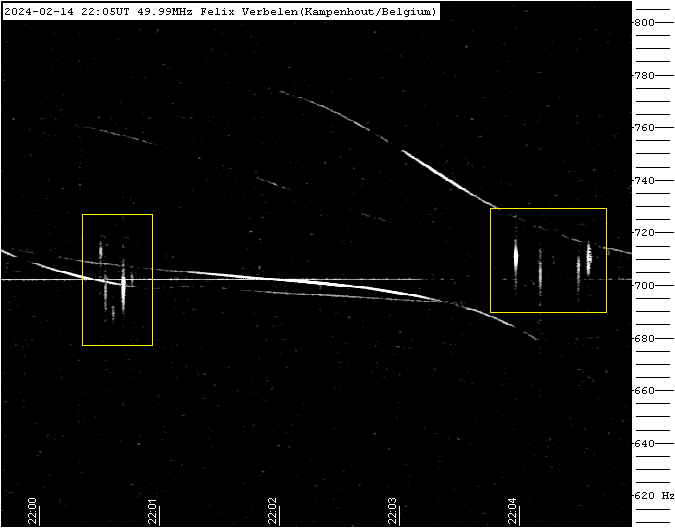
Figure 7 – Meteor echoes February 14, 22h05m UT.
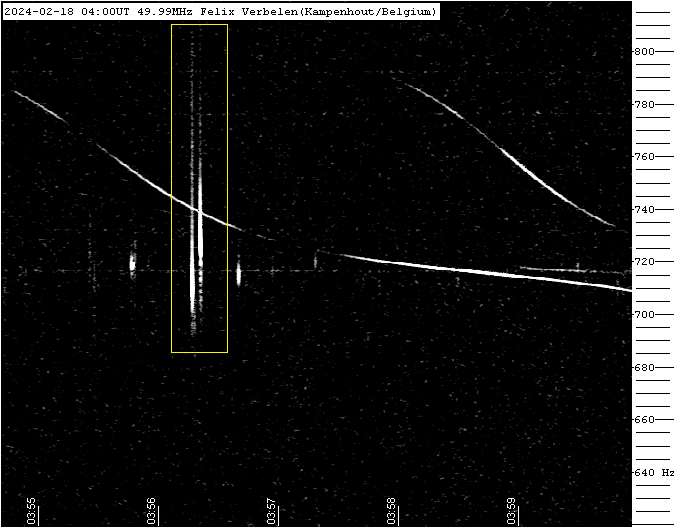
Figure 8 – Meteor echoes February 18, 4h00m UT.
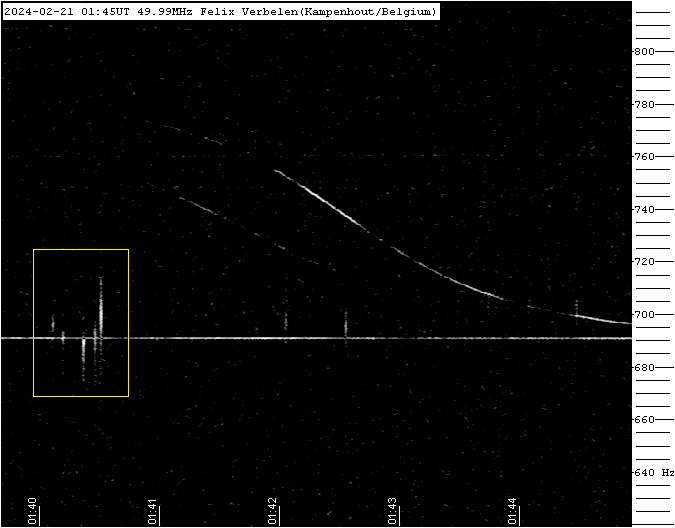
Figure 9 – Meteor echoes February 21, 1h45m UT.
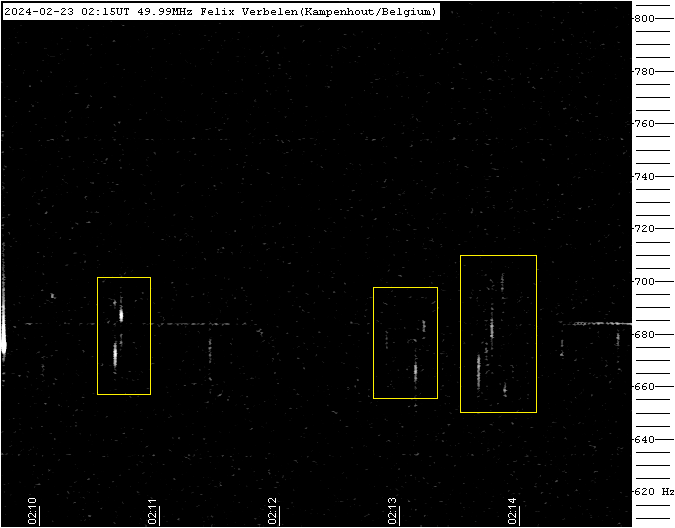
Figure 10 – Meteor echoes February 23, 2h15m UT.
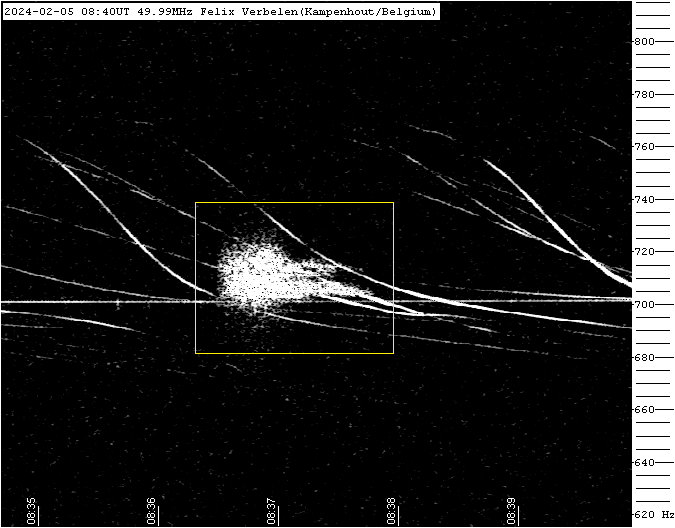
Figure 11 – Meteor echoes February 5, 8h40m UT.
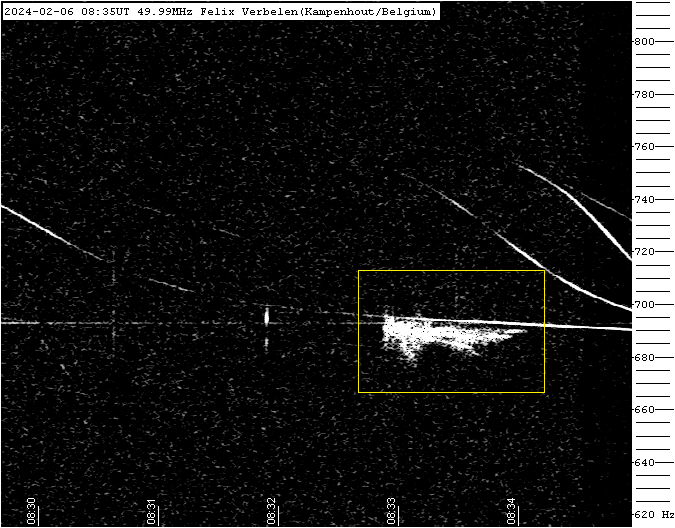
Figure 12 – Meteor echoes February 6, 8h35m UT.
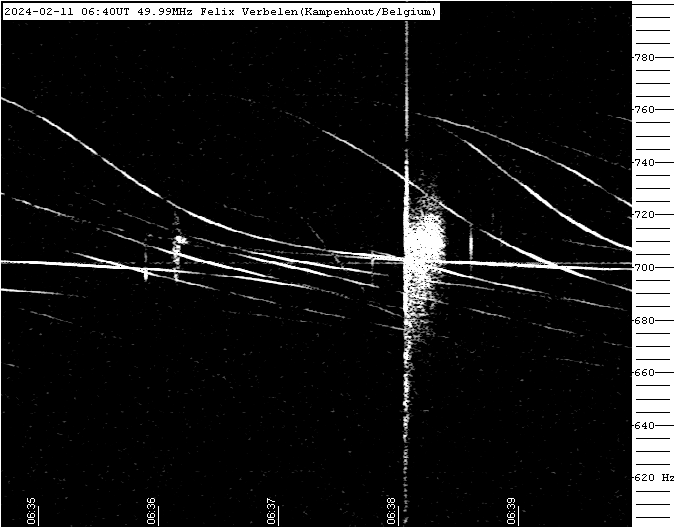
Figure 13 – Meteor echoes February 11, 6h40m UT.
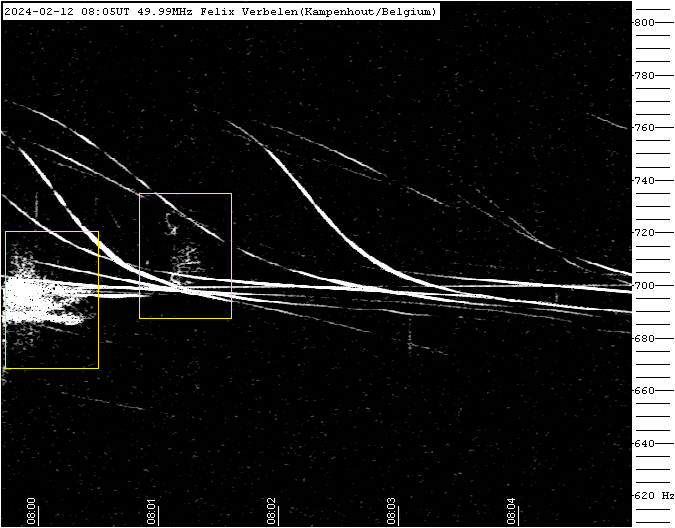
Figure 14 – Meteor echoes February 12, 8h05m UT.
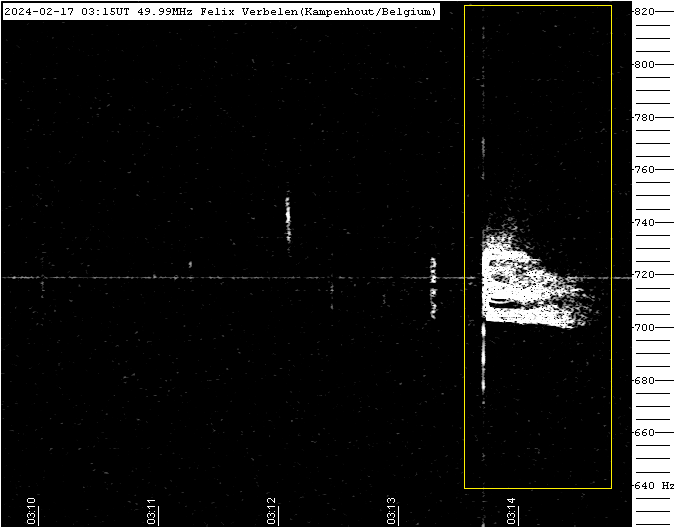
Figure 15 – Meteor echoes February 17, 3h15m UT.
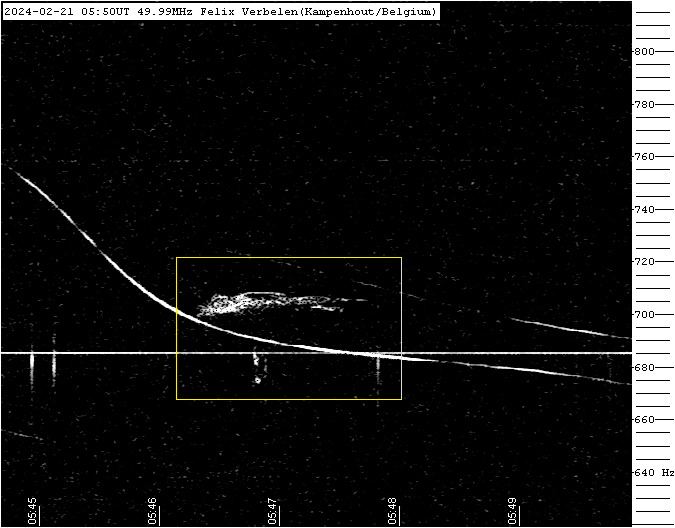
Figure 16 – Meteor echoes February 21, 5h50m UT.

