Abstract: Spectrograms of meteor echoes at different stages of the radiant position of the Quadrantid 2024 shower were examined. The analysis of the January 4th data show a very surprising result: Spectrograms of meteor echoes close in time to the notch differ significantly from spectrograms of ordinary meteor echoes. They are rather small, have a jagged surface and are similar to the spectrograms of satellites, which have a comb-like structure due to their metal surface. The reason for this could be that, for geometric reasons, only the hot plasma head with similar reflection properties to metal reflects the radar waves. When the meteor trail reflects the waves, the usual soft spectrograms are created.
The effect was discovered because the ML-software mistook meteor echoes for satellite echoes due to their similarity. The second part of this article presents a new neural network with a new class that can recognize these echoes. Data from the Perseids were analyzed with the new model. As with the 2024 Quadrantids, different echoes can be observed in the different phases of the shower. The histogram of the jagged echoes shows, for example, when the radiant of the shower has passed the 0° azimuth mark.
1 Introduction
I was able to record the Quadrantid 2024 echoes on January 4th without interference, allowing a new study of the notch. Notches in meteor histograms are known from the literature. According to Felix Verbelen (Verbelen 2019) and personal communication with him, there are notches in all major streams. He found that the number of underdense reflections will drastically decrease when the elevation of the meteor radiant becomes high (say above some 60 degrees above the local horizon). At the same time, the number of overdense (and thus long duration reflections) will increase. Wolfgang Kaufmann (Kaufmann, 2020) postulated that due to the Doppler shift, the meteor echo can lie outside the normal receiver bandwidths and is therefore not registered. In my meteor work (Sicking, 2022a) I proposed a mechanism according to which the notch is created by the geometric relationships between transmitter, receiver and radiant. An extensive work by Mike German (German, 2023) precisely explains the geometric relationships in meteor observation.
According to my own work, there are pronounced notches in the Arietids (Sicking, 2022a), in the Geminids (Sicking, 2024) Figure 11, and in the Quadrantids, this work. The Perseids show at most a faint notch (Sicking, 2022b) and this work. The new Quadrantid 2024 data should now provide further interesting insights into the notch.
2 Setup
A right hand circularly polarized 4-element Cross-Yagi antenna is used to receive the meteor echoes. The elevation is approximately 30° and it faces south towards Dijon in France. My antennas are mounted in the attic so the configuration can be easily changed. A low-noise preamplifier with a frequency range of 140-150 MHz and a noise figure of 0.25 dB is connected directly to the antenna. The receiver is an Icom IC-R8600. Spectrum-Lab (SL) from Wolfgang Buescher (DL4YHF) is used as recording software. SL generates plots at 20 second intervals with corresponding date and time in the file name, which are later analysed using machine learning-based software developed by me (Sicking, 2024). The three-class model mask_rcnn_model.061-0.417564.h5 was used for detection.
The ML-software not only counts the echoes, but also determines their size. The neural network was trained with 3D-spectrograms. If an echo is detected, a box is drawn in debug mode and labelled with the score. The program places a polygon over the detected echo that is filled with a transparent colour. The area of this polygon (not the box) is logged as the size of the meteor. The plots generated in debug mode and the original Spectrum-Lab plots were then processed into the figures.
3 Result and Discussion
Part 1: About the Quadrantids
The first two images, Figures 1 and 2, document the respective day and provide a first impression. The satellite echoes, the interference and the noise floor are also documented. Figure 1 shows the raw data from January 4th 2024. The green dots represent the meteor echoes. The sizes of the echoes are plotted logarithmically. A dip around 8h AM, the notch, is clearly visible. Figure 2 is an hourly histogram. The yellow histogram shows the rate and the red histogram shows the rate weighted by the sizes of the meteors. The size of the meteors is taken from the spectrograms, see Setup chapter. The blue histogram usually shows satellite echoes. Near the notch, the number of echoes detected as satellites by the ML-software increases and decreases with the rise and fall of positively detected meteors. This is obviously an artefact. The following analysis shows that these are also meteor echoes, but due to their unusual surface structure they were mistaken for satellite echoes by the ML-software.
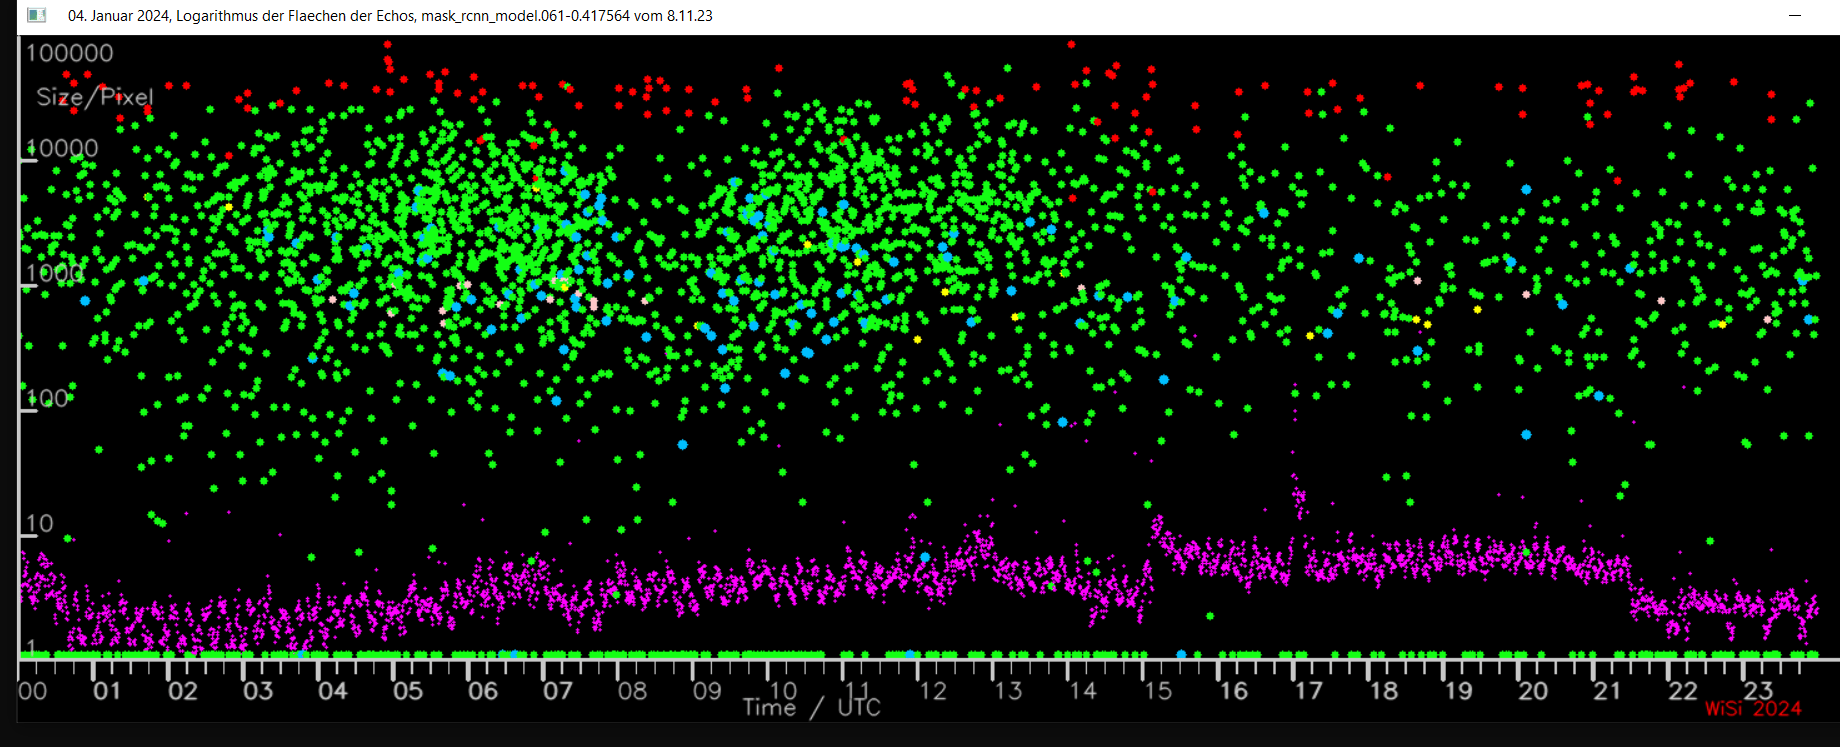
Figure 1 – Measured meteor sizes as a function of time, recorded on January 4th 2024. Each green dot represents an echo. 2962 echoes were recorded. A drastic decrease in the rate can be seen at 8h AM. The blue dots represent satellite echoes. For clarity they were plotted slightly larger than the green meteor echoes. An unusually large number of satellite echoes are registered near the notch. An explanation of this is given in the text. The purple curve shows the background noise. The red and pink dots show detected interference. There were no significant disturbances that could have distorted the result.
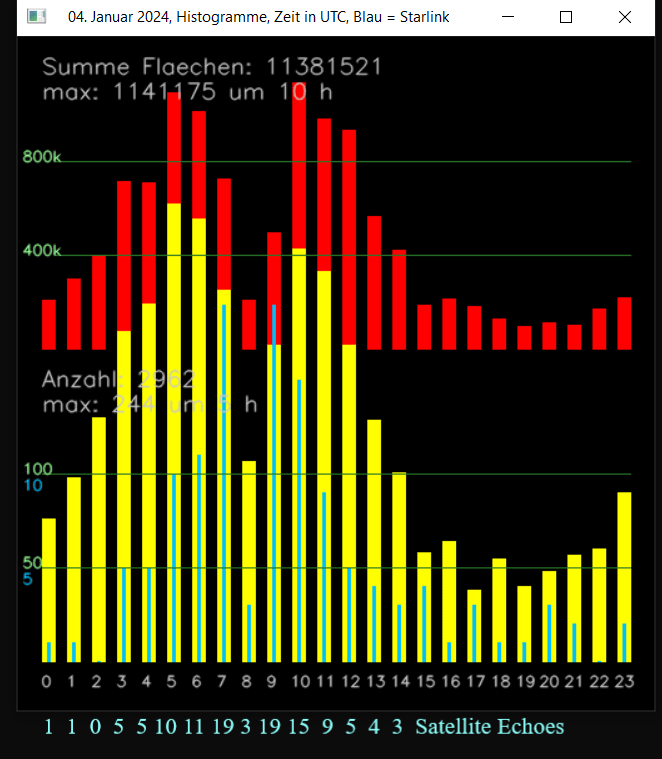
Figure 2 – The yellow histogram shows the rate and the red histogram shows the rate weighted by the sizes of the meteors. The notch at 8h AM is clearly pronounced. The number of echoes detected as satellites by the ML-software (blue) increases and decreases with the rise and fall of positively detected meteors at the notch. This is an artefact of the ML-software, see text.
About the observation of Quadrantid meteors with the GRAVES radar
First, I examined the azimuth of the radiant of the Quadrantids using Stellarium–Web. The star 44 Boötis was chosen as the radiant because, according to the CMOR radar, it occupied approximately the position of the radiant of the Quadrantids. At 7h51m AM the azimuth Dijon / 44 Boötis is 0° and the elevation of the star is 89°. At this time the radiant is in front of or over the GRAVES radar, so that the meteor tracks run towards the transmitter. Meteor tracks and radar waves then meet (more or less) head-on in a line.
Although GRAVES and my cross–yagi are directional antennas that look south with a certain opening angle, meteor echoes can be received from all directions because of the back- and side lobes, see e.g. Mike German (German, 2023) and posts in the Astronomy forum1 and2. There are examples where echoes were received at the GRAVES and BRAMS frequencies at the same time. In my work (Sicking, 2022b) it was shown that an omnidirectional antenna, a vertically polarized Discone, detects significantly more Perseid echoes than the directional antenna. That shows that echoes can also be detected overhead and north of GRAVES. The radiant does not have to be in the main lobes of the antennas. Of course, the observer receives the strongest echoes from the south often with the typical GRAVES glitches. Also because of the high power of the GRAVES radar, meteor detection works in all directions.
The high elevation angle of the radiant is not the reason for the notch. Lower elevation angles also create notches. For example, the elevation of the Arietids at the notch is 66° (Sicking, 2022a). The heights around the notch in the case of the Quadrantids 2024, viewed from Dijon, are:
6h = 71° sin(71) = 0.946
7h = 81° sin(81) = 0.987
8h = 88° sin(88) = 0.999
9h = 78° sin(78) = 0.978
10h = 68° sin(68) = 0.927
In contrast, the increase and decrease in the “visibility” of the meteor follows the sine around 0°. At an azimuth of 0°, the trail is not illuminated by the radar waves because it is hidden by the head. But at 20°, for example, 34% (sin(20) = 0.342) is “visible”. For this reason, the notch has a slim shape. For elevation, 20° only means a change in the second decimal place, see above.
Examination of the notch
The notch of the high-resolution histogram in Figure 3 shows two minima and the In-Line-Peak (Sicking 2022a), see the red dots. The first minimum appears at 8h12m AM, the second minimum at 8h42m AM. The cause of the time difference between the 0° azimuth of 44 Boötis (7h51m AM) and the first minimum of the notch (8h12m AM) is still unclear. From my understanding the times should be identical. Of course, the In-Line-Peak is weak, so the peak and minima could simply be noise like the other peaks. However, I observed the In-Line-Peak in the Arietids (Sicking, 2022a), see for example Figure 8 in the article and also in the Geminids (Sicking, 2024) see Figure 11 in the article, so perhaps they are real signals after all. Further investigations will follow.
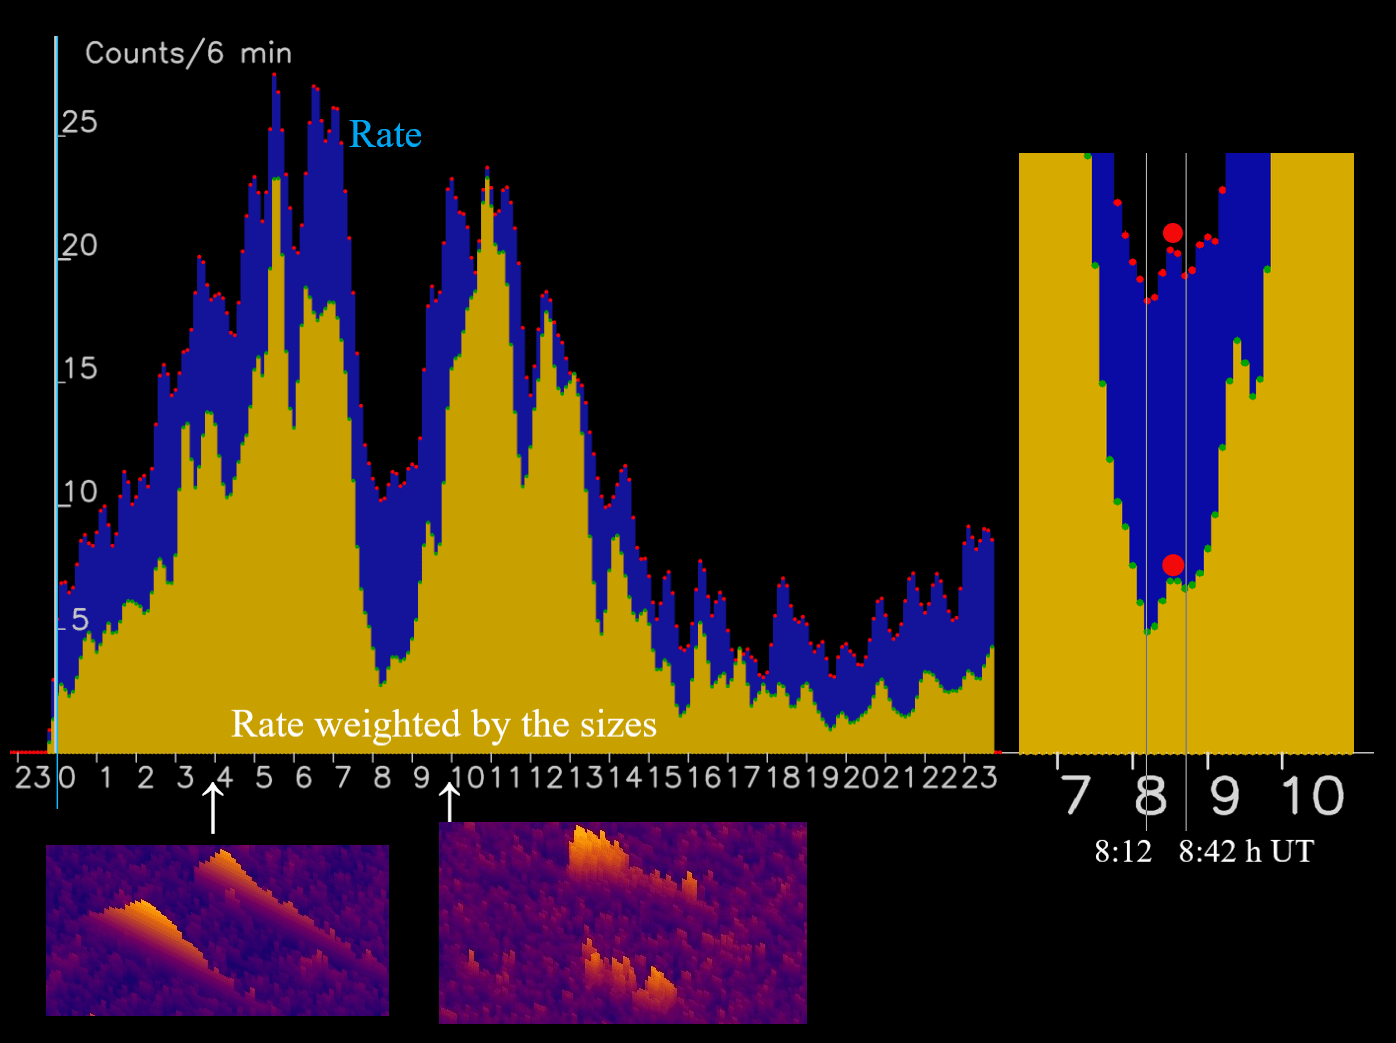
Figure 3 – The figure shows two histograms with a time resolution of 6 minutes. This allows details such as the In-Line-Peak to be displayed.
One spectrogram from 3h54m AM from before the notch (smooth) and one spectrogram from near the notch (jagged) from 9h58m AM have been included, see also the Figures below. The inset on the right shows enlarged the In-Line-Peak, see the red dots.
The histograms are smoothed with a fixed Gaussian like filter with the coefficients 0.31, 0.74, 1.0, 0.74 and 0.31.
Examination of the echoes at the notch
Spectrograms from four times before and one after the notch are shown in Figures 4 to 8. The aim is to examine the change in meteor echoes and the increase in satellite echoes towards the notch. I chose the plots so that as many echoes as possible are combined in one image in order to keep the number of images as low as possible. Because of the importance of the statement, there were five figures.
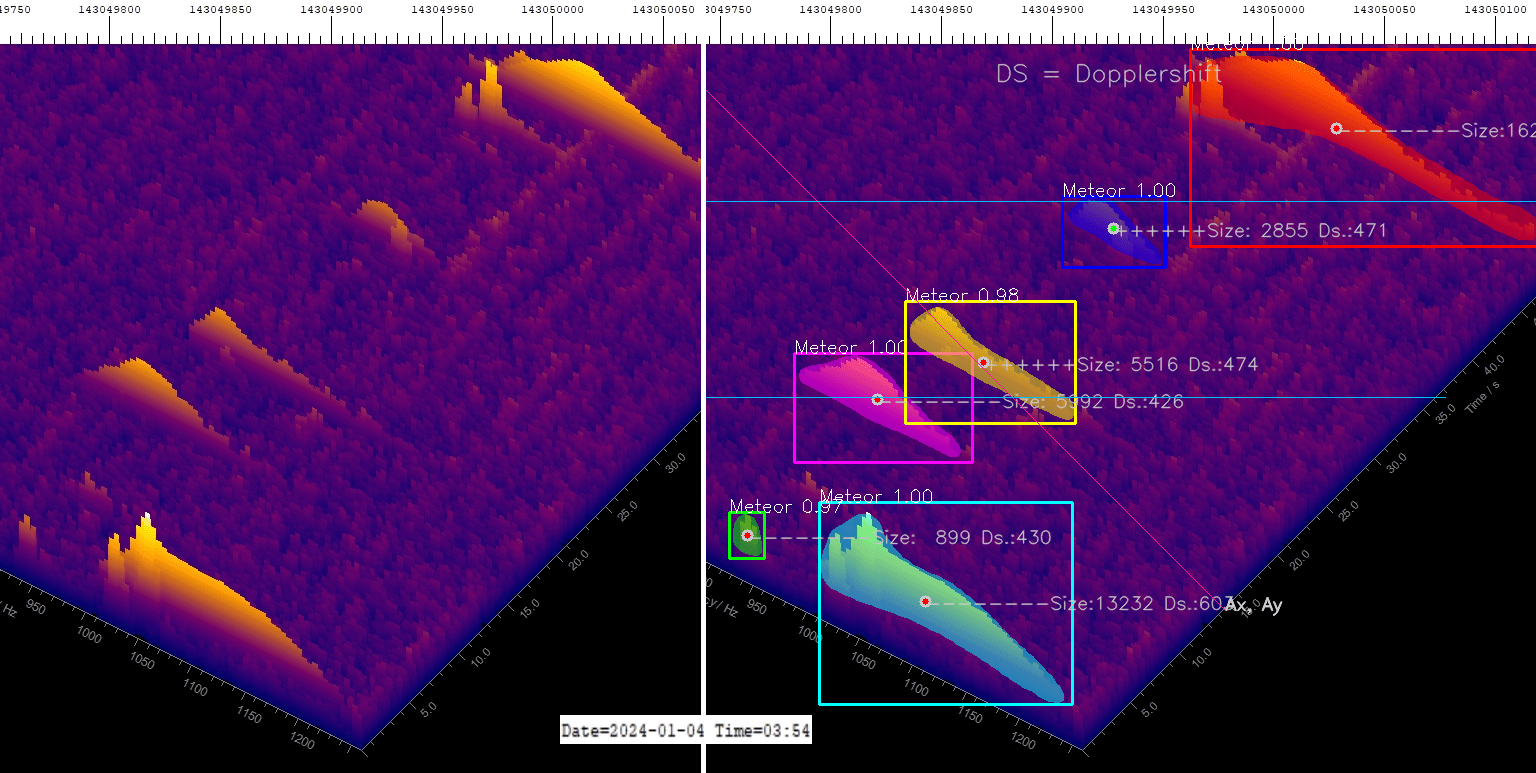
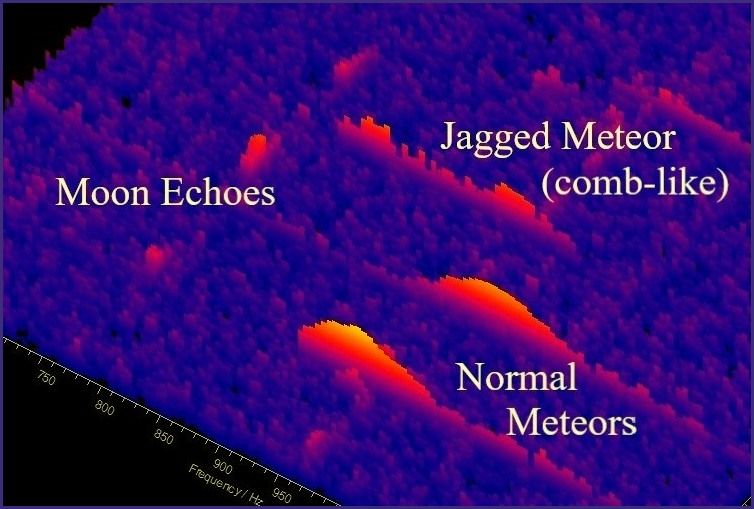
Figure 4 – 3h54m AM. Examples of “normal” echoes. The original Spectrum-Lab Echoes are shown in the left half of the picture. The echoes examined with the AI software are shown on the right. The colourful polygons represent the sizes of the echoes. For details see my AI work (Sicking, 2024).
Figure 4 from 3h54m AM shows meteor echoes commonly seen. They have the typical curved, often Gaussian shape and a smooth surface. There are of course other forms of echoes, but they don’t play a role here.
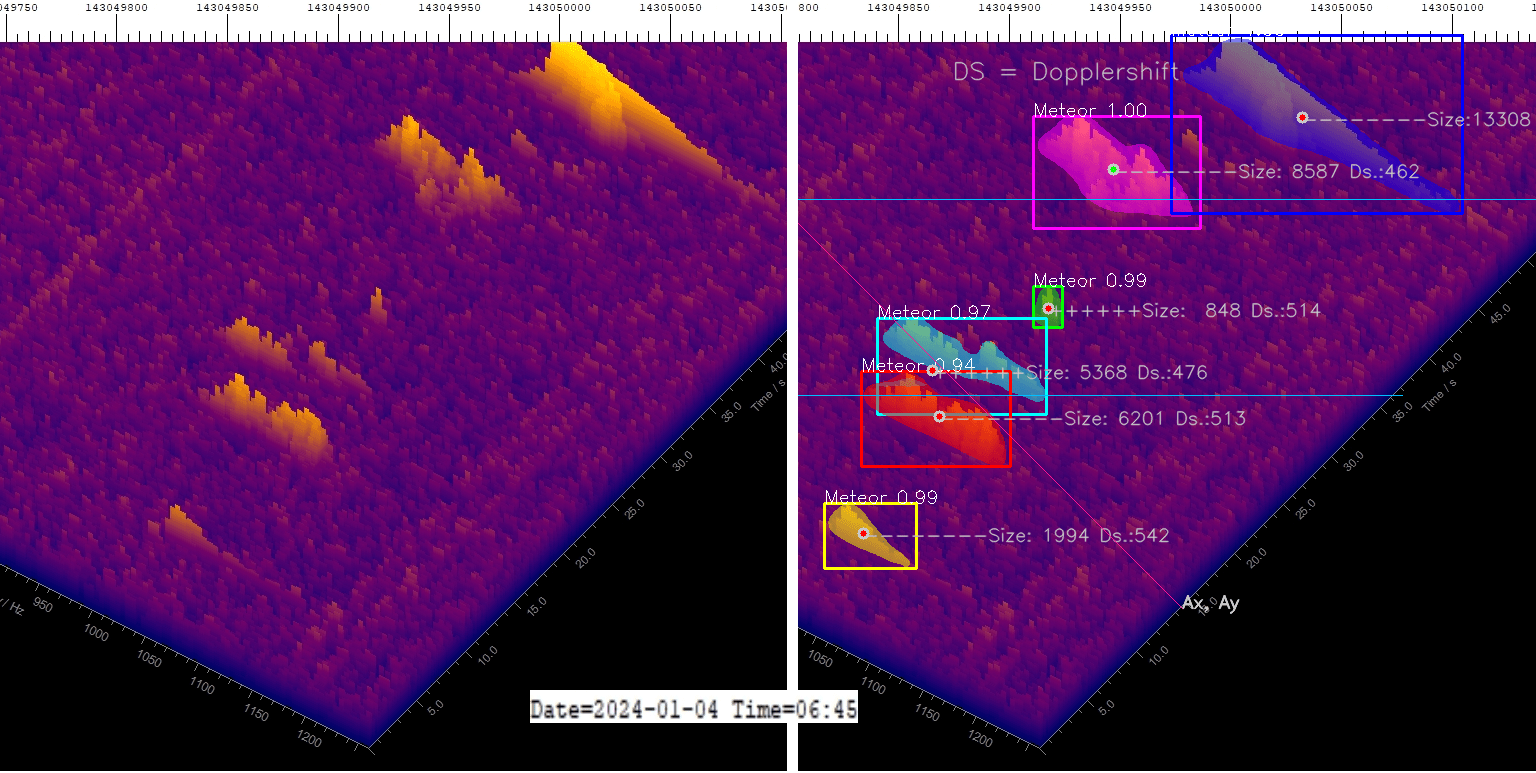
Figure 5 – 6h45m AM. The echoes show clearly a jagged surface, but are still correctly recognized by the ML-software.
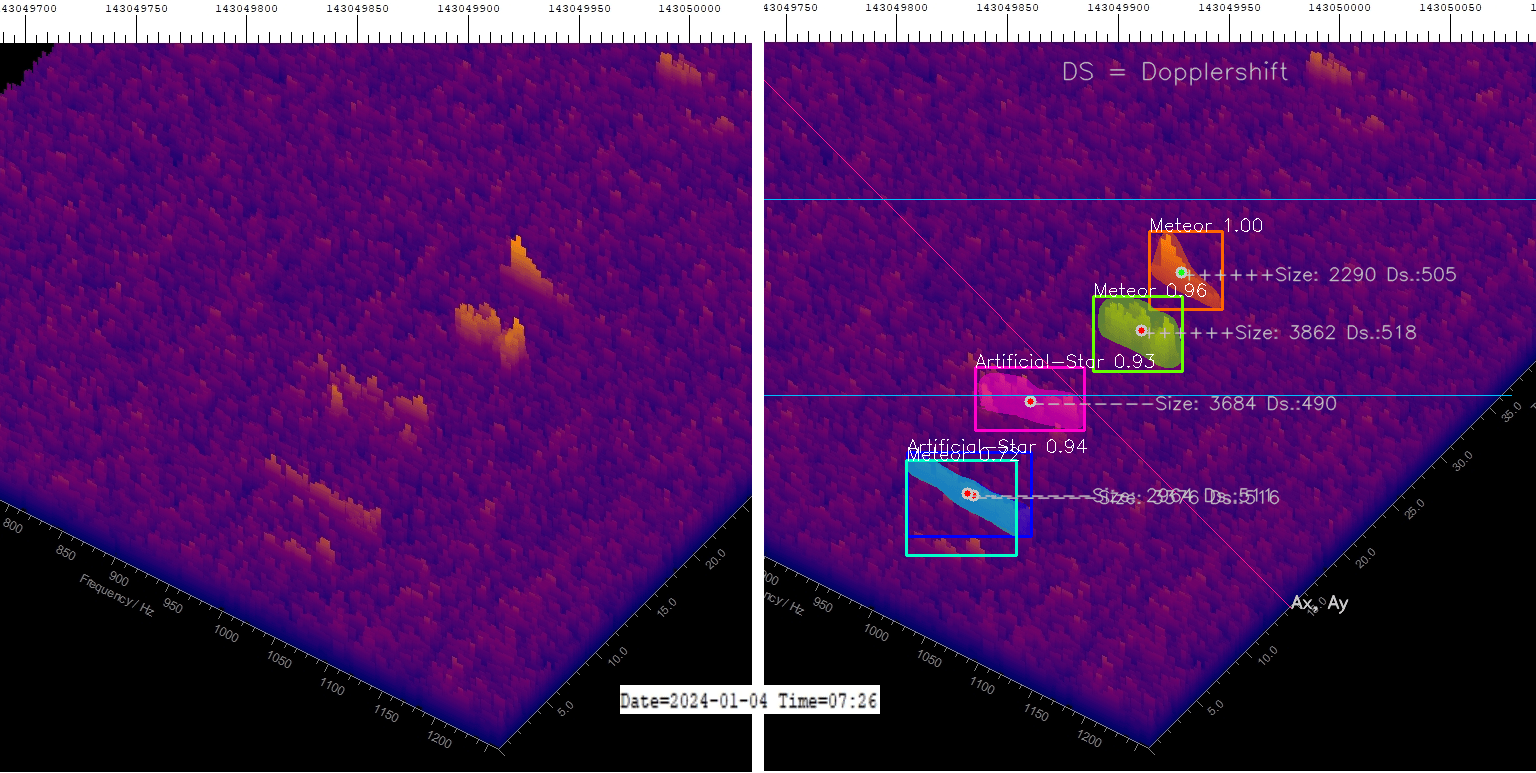
Figure 6 – 7h26m AM. The echoes are very small and are almost no longer observable. Two faint echoes are recognized as satellites.
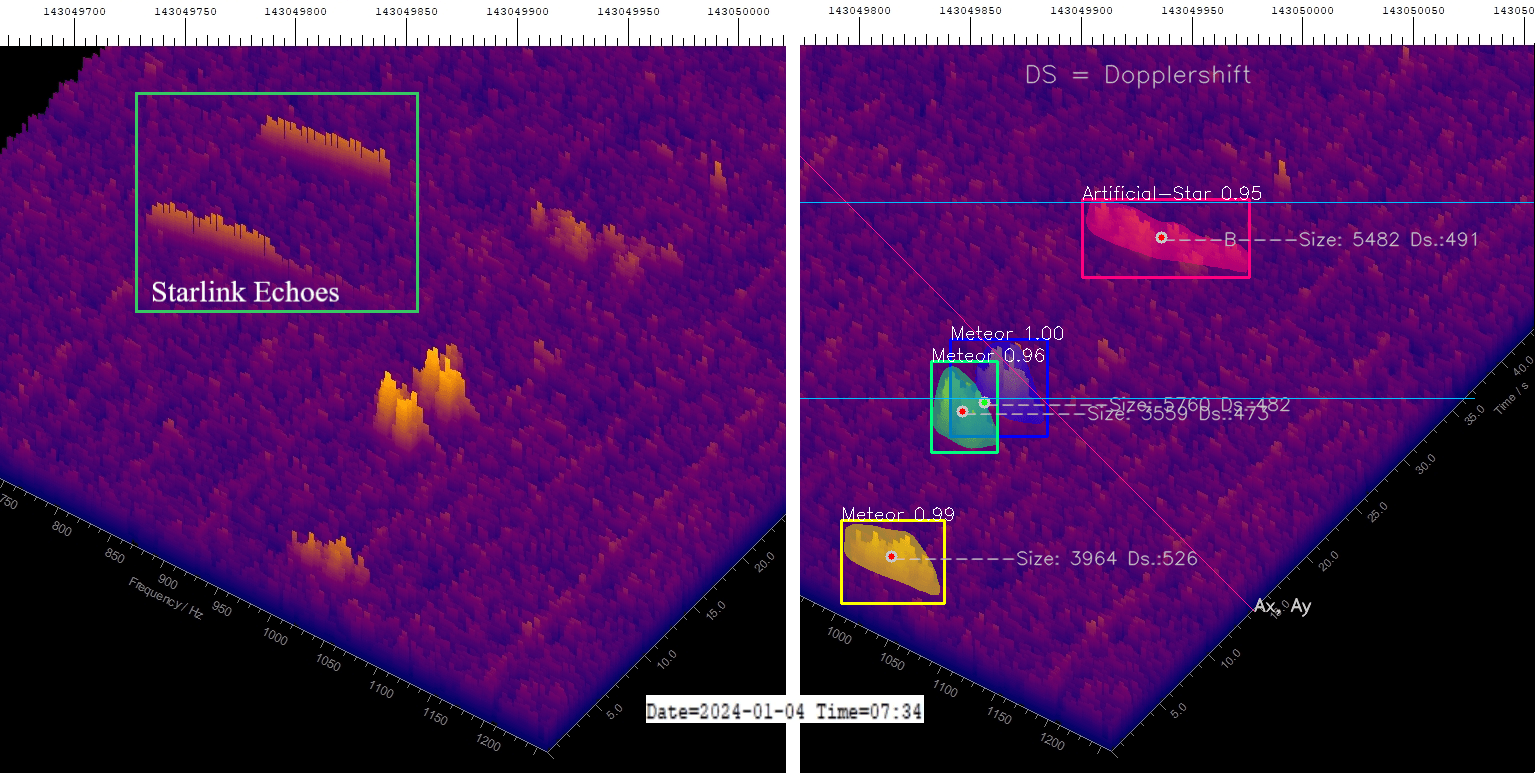
Figure 7 – 7h34m AM. An echo (magenta) is incorrectly recognized as a satellite. The inset at the top left shows real Starlink echoes for comparison.
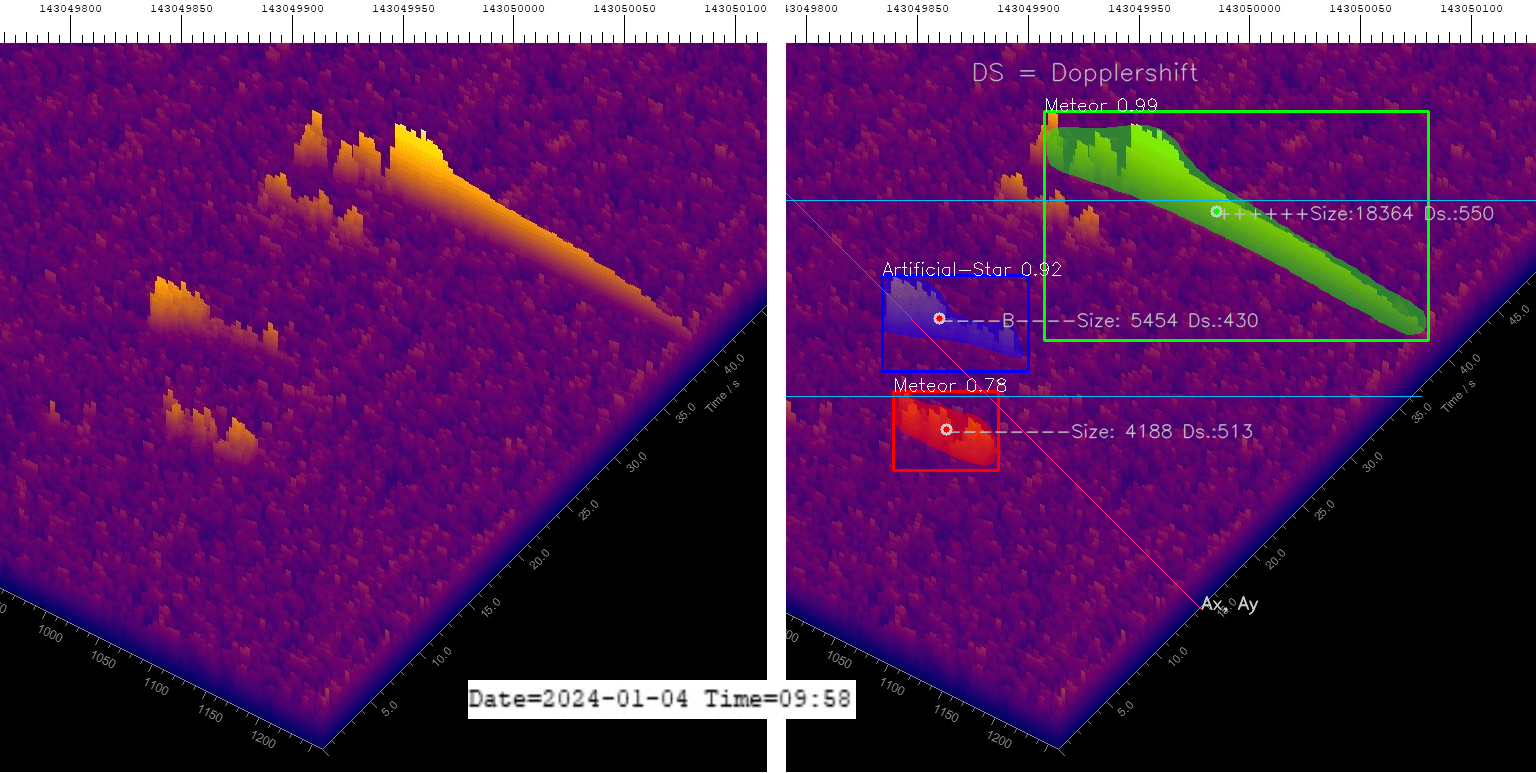
Figure 8 – 9h58m AM. Of the four echoes, only two are recognized as meteors. The red echo also has a bad score of 0.78, the blue echo is recognized as a satellite and an echo is not recognized at all.
The notch occurs because the echoes become smaller and at some point are no longer perceptible. This will be examined in more detail in the next chapter. However, the shape of the echoes also changes drastically towards the notch: They have a jagged surface, see Figures 5, 6, 7 and 8. It is now clear why the number of satellite echoes increases near the notch: Some echoes are more similar to satellite echoes, than they look like normal meteor echoes used in training the ML-model.
From this it can be concluded that Figures 5 to 8 show spectrograms of meteor echoes in which essentially only the head was exposed to the radar waves. The hot plasma head apparently has similar reflection properties to the surface of the satellites, which produce echoes with a comb-like structure due to their metal surface (Sicking, 2024). If the trace also reflects, a softer echo is created, according to my hypothesis.
In previous streams I already noticed that echoes near the notch are jagged. The increase in satellite echoes near the notch occurred for the first time in the 2024 Quadrantids.
Finally, the fact that near the notch the number of echoes detected as satellites by the ML-software increases and decreases with the rise and fall of positively detected meteors shows that there is a systematic relationship.
Such spectrograms are not contained in the training data of the ML-model used, or are only contained sporadically. However, the reason for the notch are not the misdetected or undetected echoes. At 7h AM 198 meteor echoes were recorded. Another 19 echoes were mistaken for satellites, representing an error of about 10%. The notch is also recorded by other observers.
Examination of the rates and the rates weighted by the sizes of the echoes
Figure 9 shows the echoes divided into four classes of sizes. The most important result is shown by the yellow trace, which represents the small echoes: The small echoes have a (secondary) maximum at the minimum of the notch, see the yellow dot. The amount of the larger meteors is decreasing. This does not mean that the number of small echoes has increased, but it means that large echoes now appear smaller due to perspective and appear in the class of small echoes. The maximum of the yellow trace in the minimum of the notch is therefore a confirmation of the theory that geometric conditions as described above cause the notch.
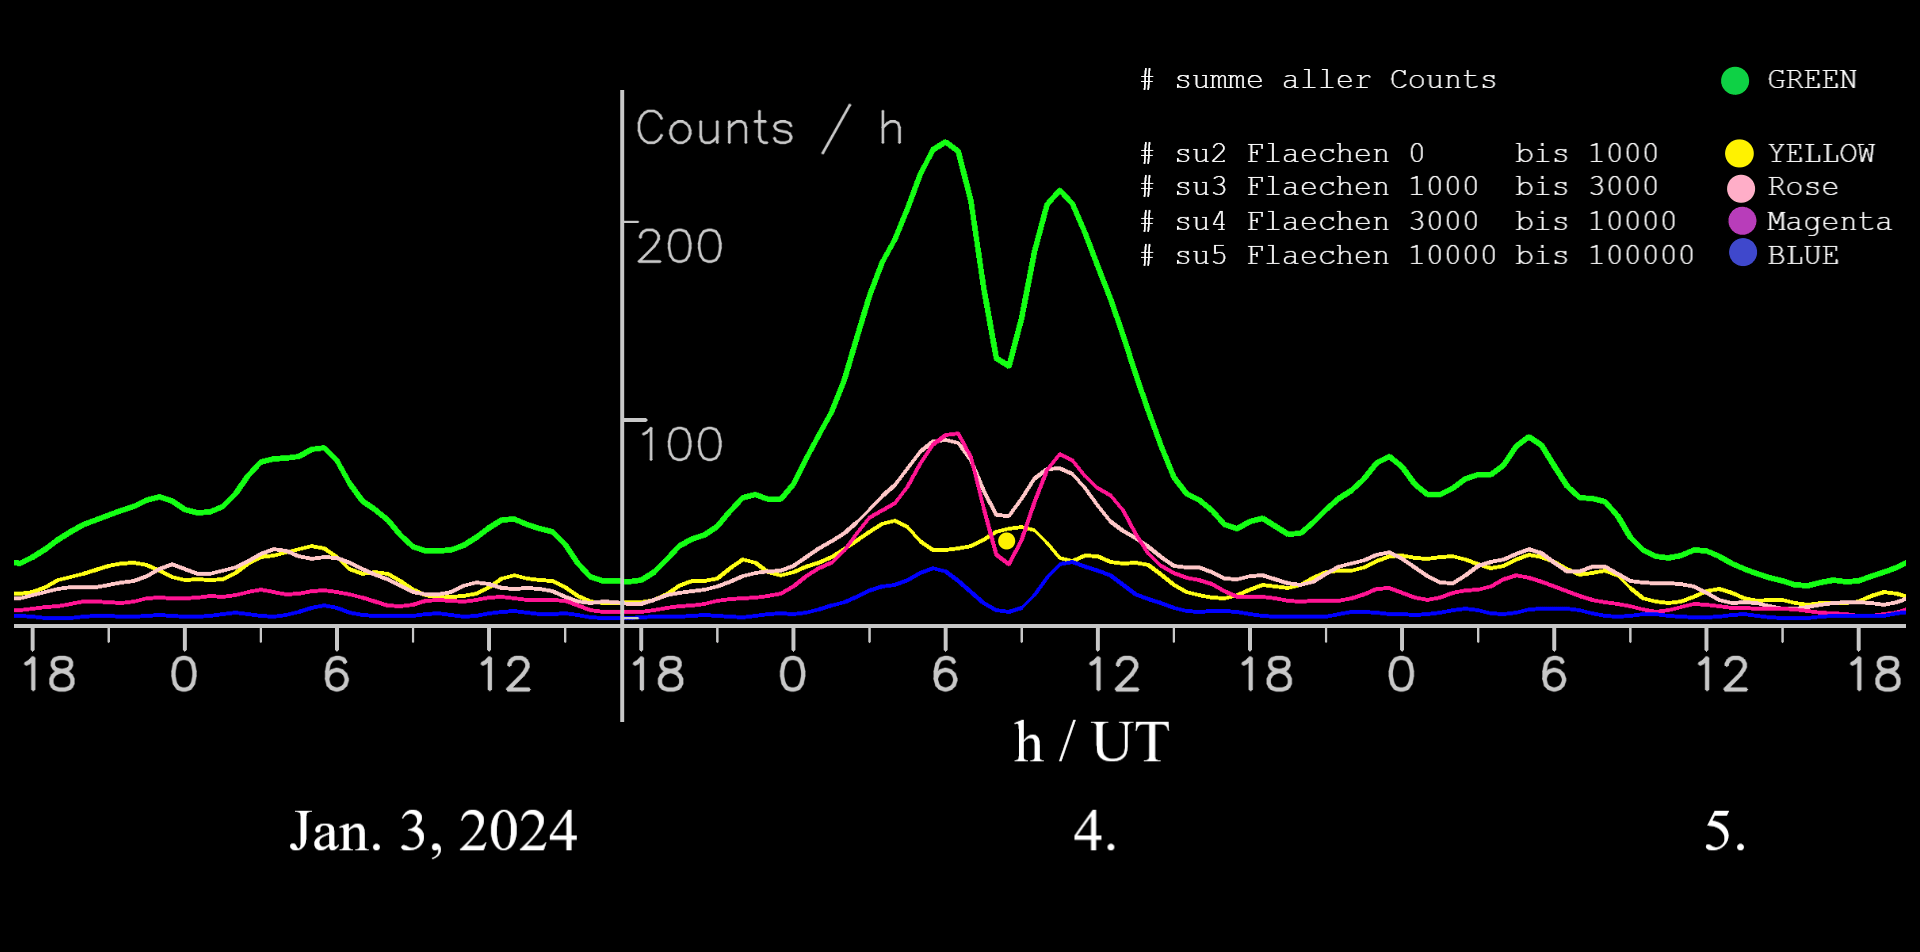
Figure 9 – Meteor rates for different echo sizes of the 2024 Quadrantids over 3 days. The blue line represents the rate of large echoes (10,000 to 100,000 pixels), the purple/magenta line shows the medium sized echoes (3000 to 10,000 pixels), the pink line shows the echoes (1000 to 3,000 pixels) and the yellow line shows the small echoes (below 1000 pixels). Finally, the green curve shows the rate of all echoes summed up. The yellow trace (echoes under 1000 pixels) shows a maximum (see yellow dot) where the notch and all other meteor sizes have a minimum. The histograms are smoothed with a fixed Gaussian like filter with the coefficients 0.25, 0.71, 1.0, 0.71 and 0.25.
Part 2: An extension of the neural network from three to four classes
The Quadrantids 2024 of January 4th contain many spectrograms of meteors with a jagged structure, as shown above. A lot of these echoes were incorrectly detected as satellites. I therefore trained a new neural network with the data from this day.
The model used so far with the three classes “Artificial Star”, “Background” and “Meteor” is based on 506 Spectrum-Lab plots, which contain multiples of signals. Now I have labelled a new class with 93 plots and almost 200 echoes of jagged spectrograms. The echoes are from near the Quadrantid notch from 6h AM to 9h59m AM on January 4th 2024. The old model still contained around 20 jagged echoes. This explains that they were partially recognized. These have been transferred to the new so called Jagged-Meteor class. The new 4-class model now also recognizes the jagged spectrograms, see Figure 10. The same Spectrum-Lab plot as in Figure 8 was used. With the new 4-class model, all meteor echoes are correctly recognized: three as jagged echoes, one as a normal echo. Of course, the plot is not included in the training data set.
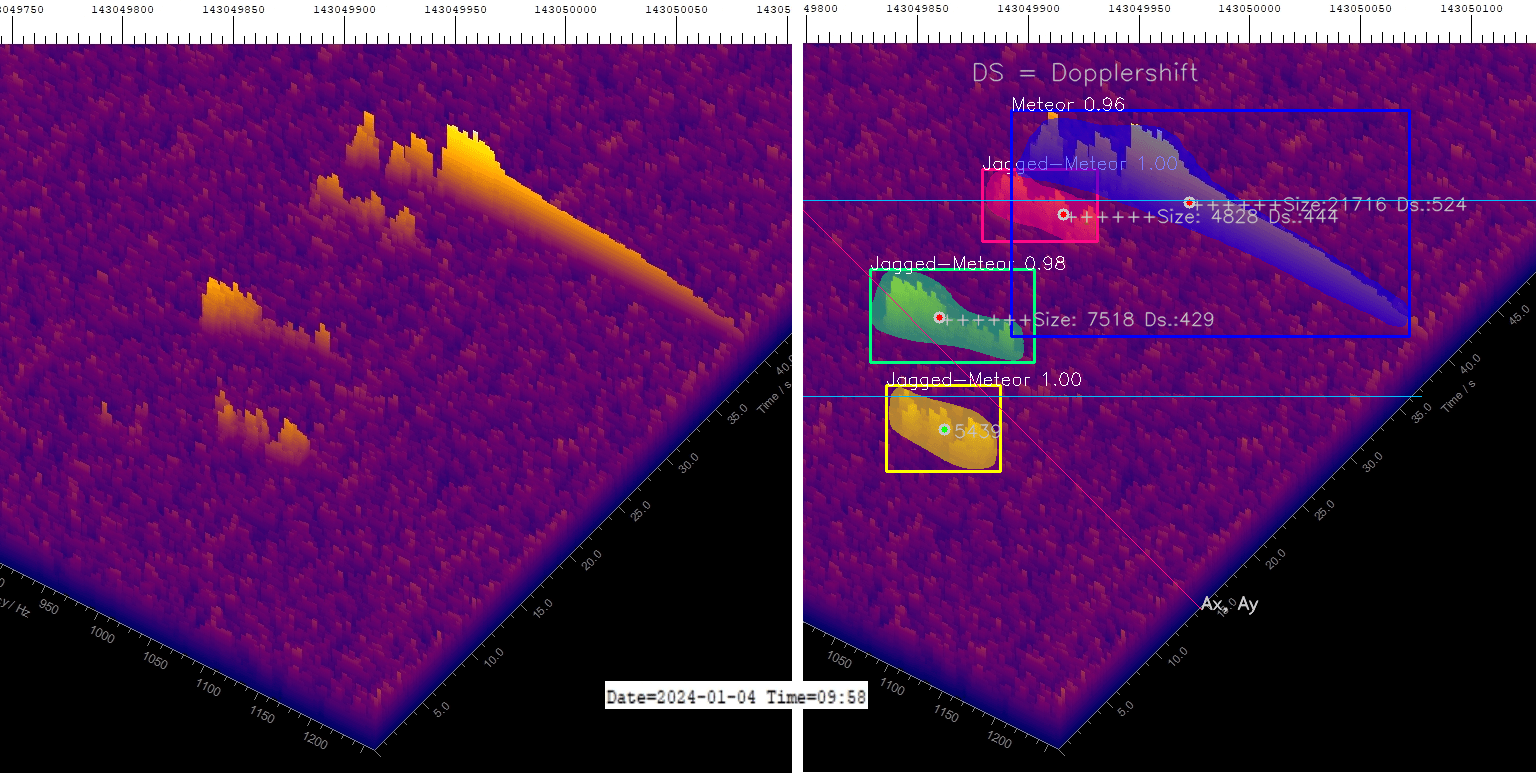
Figure 10 – 9h58m AM. Figure 10 is based on the same Spectrum-Lab diagram as Figure 8. With the new 4-class model, all meteor echoes are correctly detected: three as jagged echoes, one as normal echo. In Figure 8, only two echoes were correctly detected. This plot is not included in the training data. It was saved for testing and demonstration purposes.
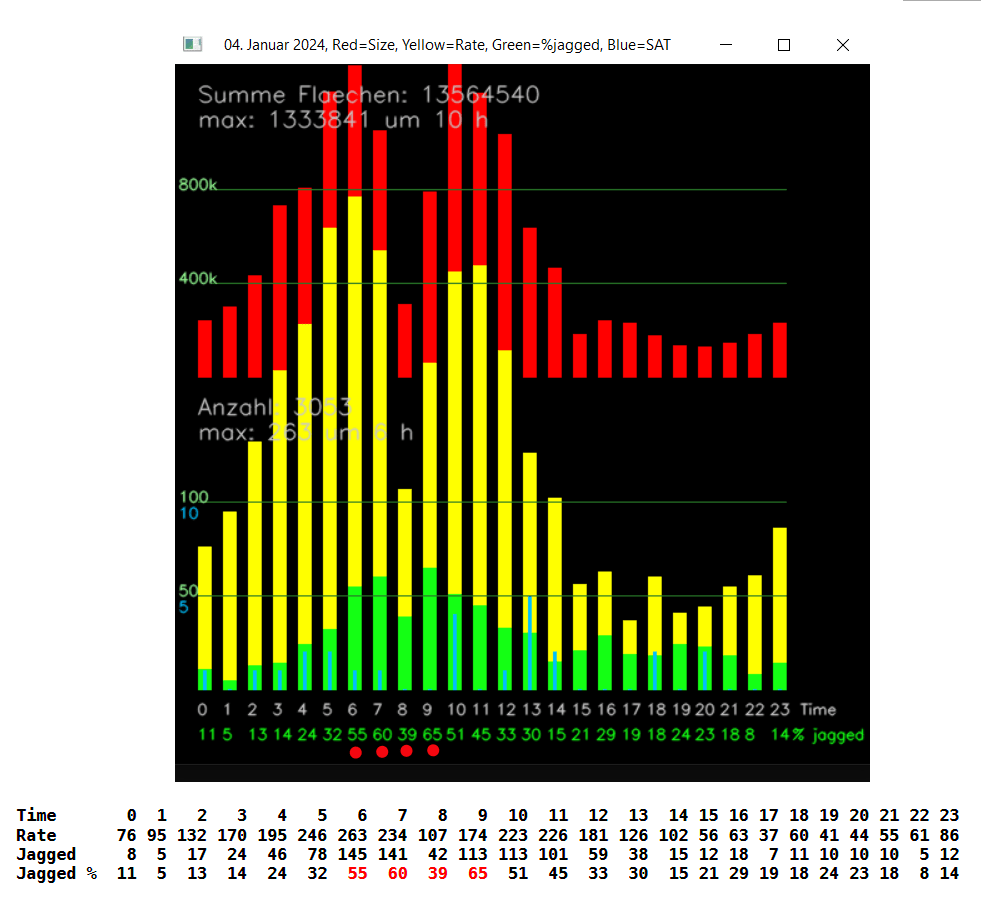
Figure 11 – The figure shows the analysis of the data from January 4th 2024 with the new model. The yellow and red histograms show the rates and the size-weighted rate of the meteors as in Figure 2.
The rate, i.e. the yellow histogram, is listed again with numbers in the second line. The values contain all positively detected meteors and jagged meteors.
Line three shows the number of jagged echoes it contains.
The fourth line is the percentage of jagged echoes, i.e. the number of jagged echoes/total number x 100%. These values are plotted in the green histogram.
It must be remembered that data from 6h-9h AM (see the red dots) were used in training. The old model counted 2962 meteor echoes and 127 satellite echoes. That’s a total of 3089 echoes. The new model counts 3053 meteor echoes and 25 satellite echoes. That’s a total of 3078 echoes.
I wasn’t actually supposed to study the January 4th Quadrantids with the new model because the echoes were used in training. Nevertheless, I would like to show the evaluation to demonstrate the new model, see Figure 11. It shows a similar output to Figure 2. The yellow and red histograms show the rate and the size-weighted rate of the echoes. The jagged echoes are included in these values. The green histogram is new. It shows the percentage of jagged echoes.
The satellite echoes no longer correlate with the meteor echoes. The proportion of jagged echoes provides interesting insights. For example, 65% of jagged echoes are present at 9h AM. This is a significant difference from midnight. However, it must be remembered that data from 6h-9h AM (see the red dots) were used in training. In the next chapter, I used this method to examine data that were not used in training.
First results achieved with the new neural network
The following analysis of the Perseids 2022 shows the possibilities of the method very clearly. The model is not yet perfect and still needs to be fed with additional label data. Occasionally, double detection of normal and jagged echoes occurs. However, I have checked all analyses using a high score method: Only echoes with a probability greater than or equal to 98% were analyzed. This does not change the statement. One example is shown below.
I selected the data from August 10th to 14th 2022 because no data from these days were used for training and there was relatively little interference.
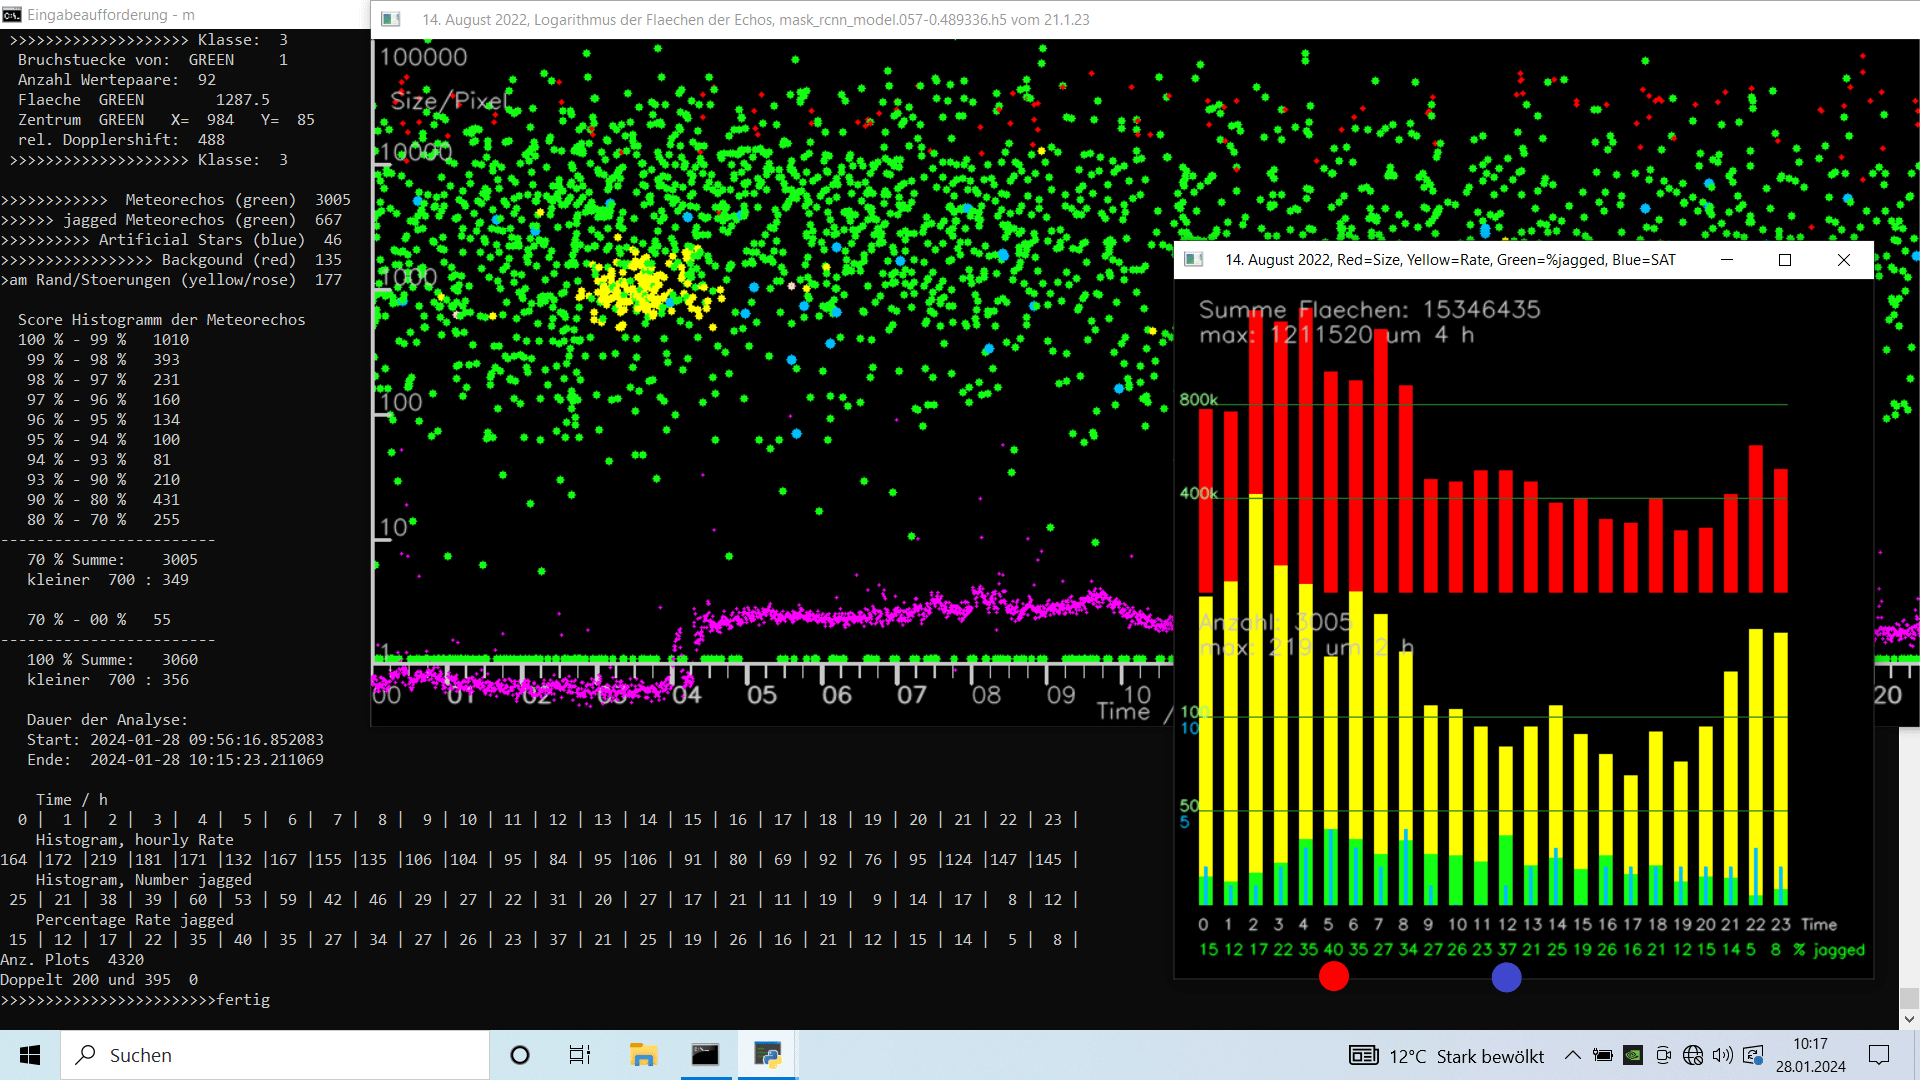
Figure 12 – Figure 12 shows an example of the output of my ML-software from August 14, 2022. The data from the inset on the right are included in Figure 14 . From 3h AM, many moon echoes were received, see the accumulation of yellow dots.
The percentage of the jagged echoes has a maximum at 5h AM, indicating, that the radiant has crossed the 0° mark, see the red dot. However, there is a second maximum at 12h PM, see the blue dot. In combination with the small notch, one can conclude that there was a second radiant, see text.
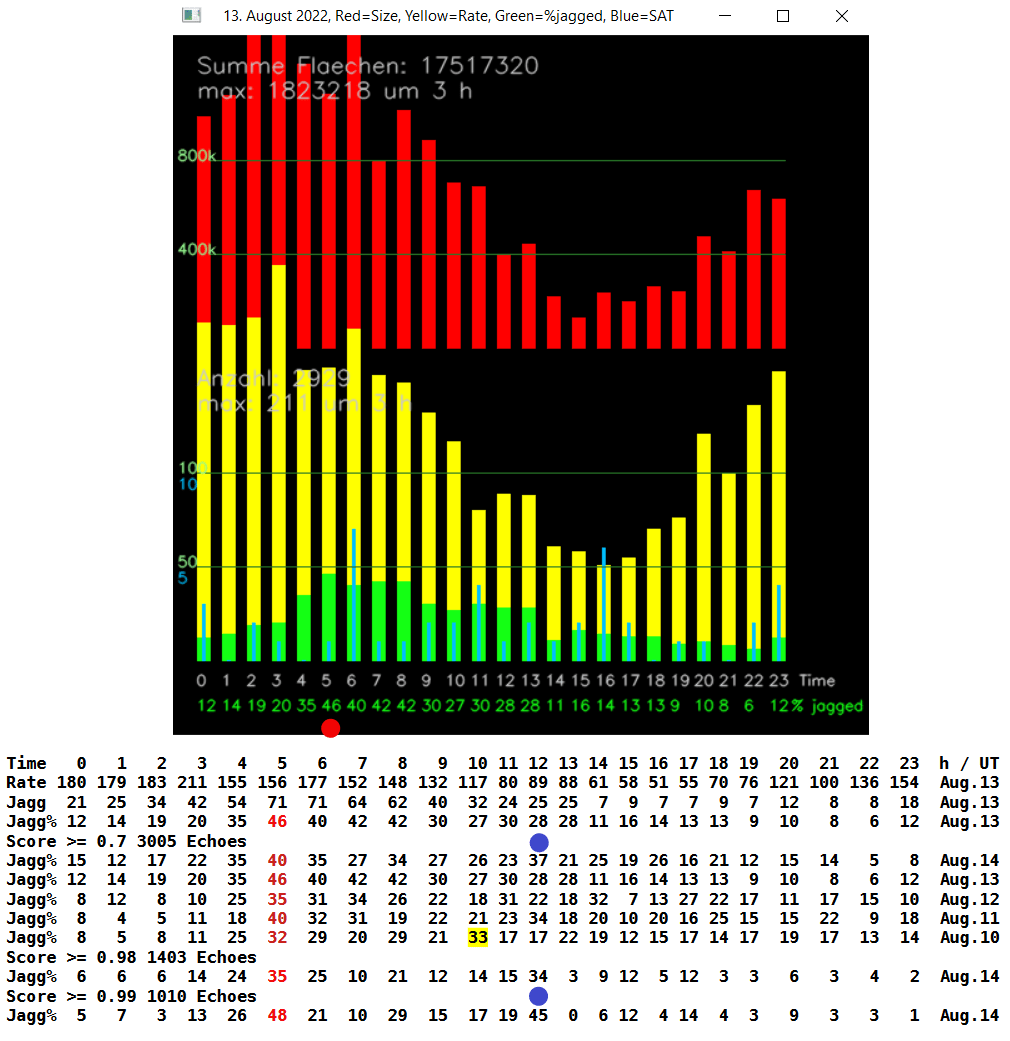
Figure 13 – The histogram shows the analysis of the data from August 13th 2022 with the new model. The yellow and red histograms show the rate and the size-weighted rate of the meteors as in Figure 2. The rate, i.e. the yellow histogram, is listed again with numbers in the second row. The values contain all positively detected meteors and jagged meteors.
Row three shows the number of jagged echoes it contains.
The fourth line is the percentage of jagged echoes, i.e. the number of jagged echoes/total number x 100%. These values are plotted in the green histogram. The remaining rows show the percentage of jagged echoes from August 10th to 14th. With the exception of 10th August the percentage of jagged echoes has a maximum at 5h AM, see the values marked in red. The last two rows show an evaluation from August 14th, in which the score was set to 0.98 and 0.99. The blue dots indicate a local maximum on the same day.
Figure 12 shows an example of the output of my ML–software from August 14th, 2022. The data from the inset are included in the table in Figure 13. Similar plots were evaluated from August 10th to 14th and summarized in the table.
From 3h AM, many moon echoes were received, see the accumulation of yellow dots. This shows how powerful the GRAVES radar is.
The table in Figure 13 shows that on almost all days the percentage rate of jagged echoes has a maximum around 5h. In order to compare this time with the azimuth of the Perseids, I determined the 0° azimuth of the radiant using Stellarium–Web.
The star HD15449 was chosen as the position of the Perseid radiant. It has an azimuth of 0° and an elevation of 79° at 5h43m AM on August 14th.
However also Eta Persei (6h02m AM, 0° Az., 81° El.) and Gamma Persei (6h17m AM, 0° Az., 83° El.) may be good candidates.
These times fit with the maximum of percentage of jagged echoes at 5h AM. Also a small notch can be seen in the histograms from August 13th and 14th 2022 at this time.
However, upon closer inspection, there are two maxima in the green histogram in Figure 13 that are similar to those of the Quadrantids (Figure 11), only significantly weaker. Such notches are actually faintly visible in the table. The numerical values on August 13th are 5h=46%, 6h=40% and 7h=42%. On August 12th the corresponding values are 5h = 35%, 6h = 31%, 7h = 34%. The radiant passage at 0° was therefore closer to 6h AM, which corresponds well with the times of the three stars.
A burst and the high score test
At 12h PM on August 14th, the percentage of jagged spectrograms is quite high at 37%, see the blue dots in Figures 12, 13 and 14. According to my work (Sicking, 2022b), there was a small outburst at this time.
In order to prevent errors, e.g. due to double detection or false detection, I also carried out all evaluations with a high score. Only values whose probability is greater than or equal to 98% were included in the evaluation. Figure 14 shows an evaluation using this method from August 14th. Of the 3005 echoes in Figure 12, only 1403 echoes meet the criterion. Although there are fewer but better points in the evaluation, the test confirms the result of Figure 12: The two maximums at 5h AM and 12PM remain. A final test with a score of 0.99 confirms the result and increases the two maxima even further, see the last entry in the table in Figure 13.
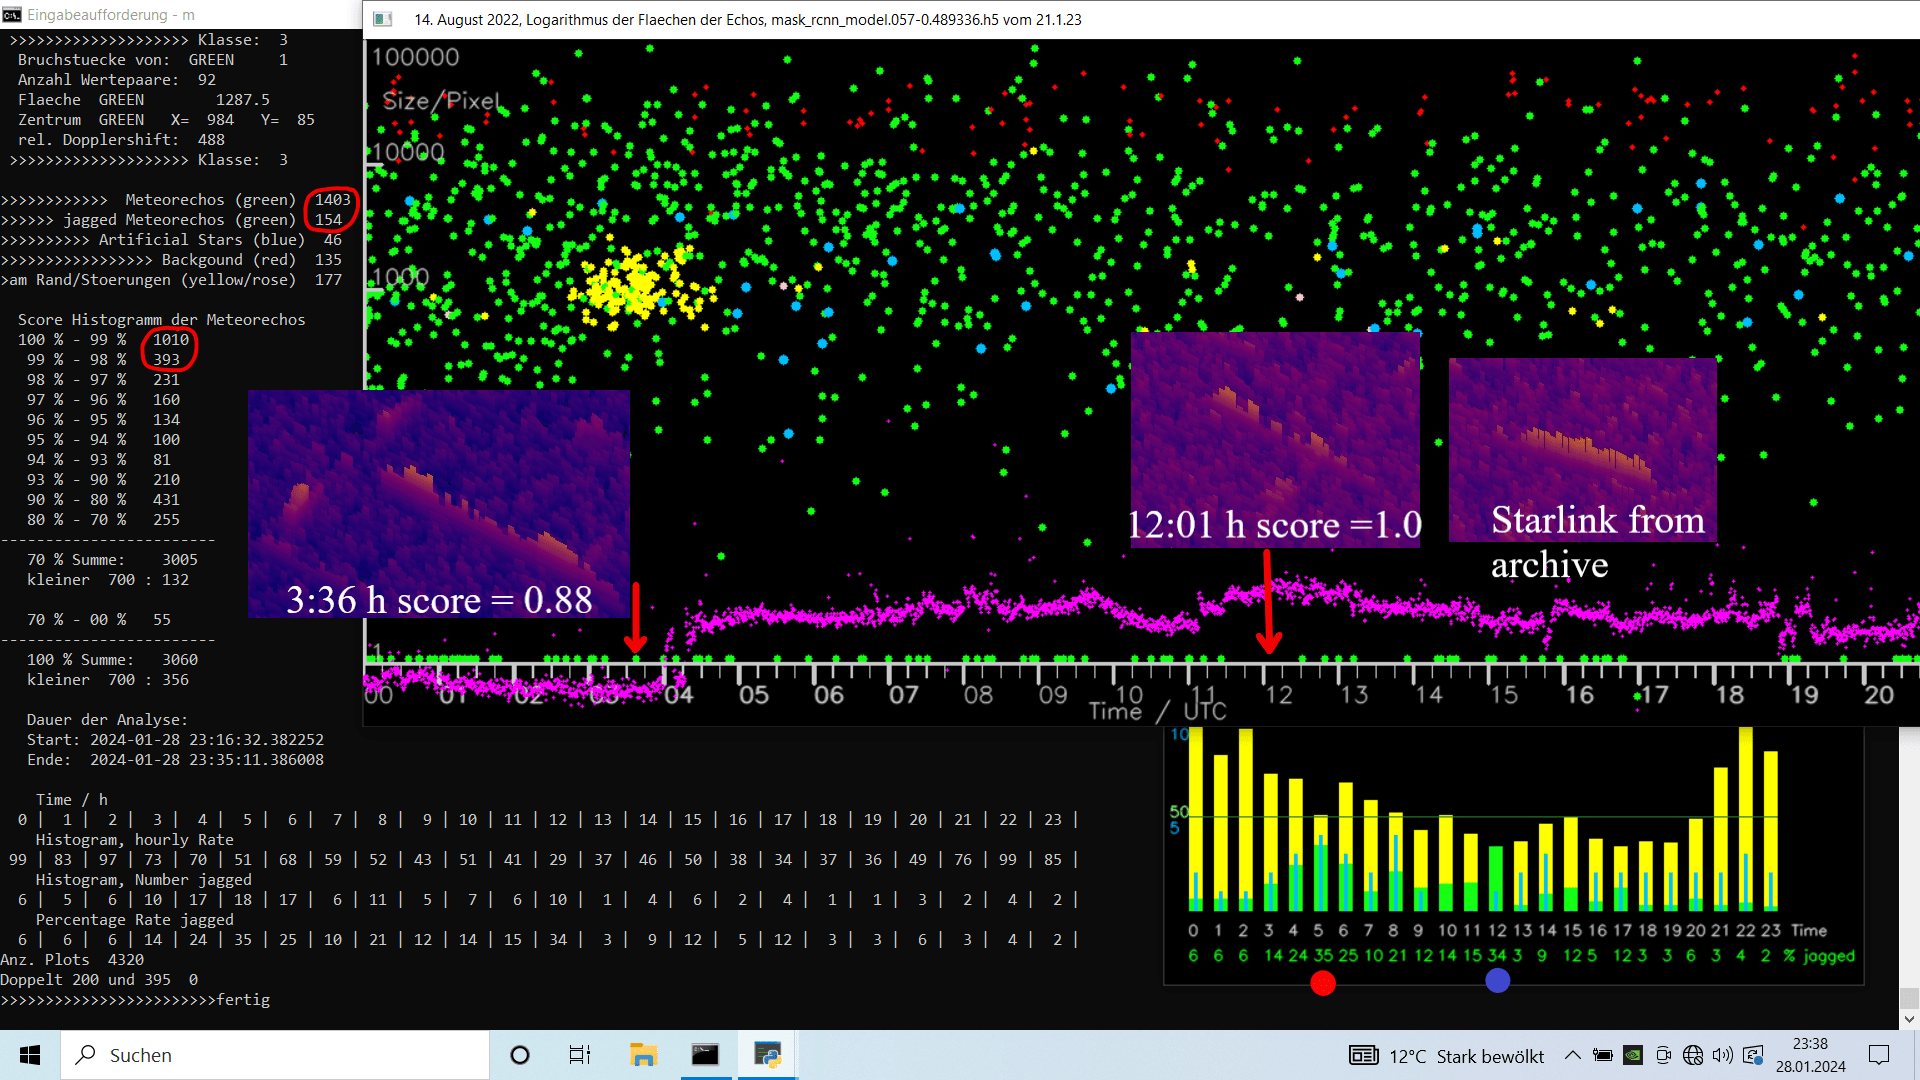
Figure 14 – Figure 14 shows the same day as Figure 12, August 14th. However, only values that have a probability of better than or equal to 98% were included in the analysis. The values are included in the table in Figure 13. The insets show examples of the background. The comparison shows that the noise in the plot is shown greatly enlarged and the level should have no influence. The inset on the left side shows two moon echoes and a jagged meteor with a score of 0.88, see also the graphical abstract. The middle inset shows a jagged meteor with a score of 1.0 from 12h AM. It belongs to the postulated burst. The echo in the inset on the right is a starlink echo from archive for comparison, see text.
Figure 14 also shows 3 insets. This is intended to show that the noise floor has no influence on the quality of the echoes. A comparison with a Starlink satellite is also shown. One difference between the satellite echo and the meteor echo is the angle created by the different Doppler shift. The jagged echo from 12h PM has a score of 1.0. The satellite has a score of 0.98, in its class of course.
To the errors
In Figures 12 and 14 it appears that the green histogram correlates with the satellites up to 7h AM. This is not a systematic error. On other days, the distribution of satellite echoes is random, see e.g. Figure 13. The satellite scale is also stretched by a factor of 10 compared to the scale for the rate. There are only four satellite echoes at 5h AM. Two of them are unrecognized meteors. Of course, the software does not work without errors. There are double and false recognitions. I therefore repeated the evaluations using the high score method. Only echoes with a probability greater than or equal to 98% were evaluated. That’s about half, see Figure 13. This should reveal an error in the system. However, the high score method confirmed the result of the overall analysis, see Figure 14 and the table in Figure 13, last two rows.
Finally, I only examined one stream over several days and not several streams with perhaps only one day. This makes it easier to identify errors and outliers.
What do I want to do with it?
So far my approach has been to detect weak showers observing the notch, because a notch is easier to detect than a broad maximum. This is also used, for example, for the minimum bearing. Radio-amateurs use the procedure in the so-called “Foxhunting”. According to this work, the azimuth passage can be extracted directly from the shape of the spectrograms, as the echoes are “smooth” far from the 0° / 180° azimuth passage and “jagged” near and at the passage. The method also appears to be sensitive: A (secondary) maximum at 5h AM can already be seen on August 10th and a second maximum at 12h PM on August 14th probably indicates a second radiant.
Further investigations will follow. For further measurements I will test another location in the near future, see (Sicking, 2024) Figure 12. This is a location without interference, at least when there is no contest operation.
4 Conclusion
Inspired by an obvious artefact, I examined spectrograms at different stages of the radiant position of the Quadrantid 2024 shower. The work shows that spectrograms taken near the notch are different from spectrograms taken at other times. It is concluded that spectrograms could be used to identify meteors where the radar waves hit the meteor head-on and illuminate only the plasma head.
In addition, the theory that geometric conditions cause the notch has been experimentally proven.
In the second part of the article, a new neural network was presented. The new model appears to be well suited to studying meteor spectrograms at different stages of the shower. The percentage of jagged spectrograms provides interesting insights into the showers and will be used to study future showers and sporadic meteors. This is going to be exciting.
Acknowledgment
Many thanks to Mike German, Stefanie Lück, Kerstin Sicking, Ulrich Sperberg and Felix Verbelen for proofreading and for the many comments. My special thanks go to Mike German, who made many detailed comments and suggestions for improvement. This greatly enhanced this article.
References
Verbelen F. (2019). “Meteor velocity derived from head echoes obtained by a single observer using forward scatter from a low powered beacon”. WGN, Journal of the International Meteor Organization, 47:2, 49–54
German M. T. (2023). “Utilizing Video Meteor Trails to Understand Radio Meteor Detection”. WGN, Journal of the IMO, 51:4, 72–92.
Kaufmann, W. (2020). “Limitations of the observability of radio meteor head echoes in a forward scatter setup“. WGN, Journal of the International Meteor Organization, 48:1, 12-16
Sicking, W. (2022a). “A Notch in the Arietids Radio Data and a new so called In-Line-Effect”. EMetN, 7:5, 331-335.
Sicking, W. (2022b). “Radio observations on the Perseids and some other showers in August and September 2022”. EMetN, 7:6, 407-410.
Sicking, W. (2024). “Meteor detection using Artificial Intelligence and Machine Learning”. EMetN, 9:1, 29-36.
2https://forum.astronomie.de/threads/parallel-aufzeichnung-von-brams-meteor-echos-und-graves-meteor-echos.308016/

