Abstract: Meteor showers of the daytime Arietids (ARI), the Zeta Perseids (ZPE) and the daytime Lambda Taurids (DLT) were observed as echoes with the GRAVES radar, France, from June 9 to June 19, 2022. According to CMOR radar, the Arietids were the dominant stream in this time window. Although the ARI radiant height should have its maximum at around 9h UT, the meteor detection rate exhibited a second maximum at 12h-13h UT. A closer look at the detection rate reveals a notch in the rate around 11h UT causing the measured rate to have two maxima. It turns out that the large echoes are mainly causing this dip. Unexpectedly, the small echoes show the opposite: a maximum appears at the minimum of the notch.
-
Introduction
In order to study meteor showers and sporadic meteors, I have developed a software that not only determines the rate but also the sizes of the meteor echoes.1 The dots in Figure 1 represent the measured echo sizes as a function of the time for June 9 as an example. About five orders of magnitude of echo size are resolved. 1461 echoes were counted. The yellow histograms in Figure 2 show the rate and the red histograms show the rate weighted by the sizes of the meteor echos. Figure 3 shows a representation that makes it possible to view the rate development of the differently sized echoes over several days. In these diagrams, the sporadic meteors and the streams, if any, are superimposed. Figure 2 shows beside the histogram of June 9 the rates of May 14 as an example, which mainly contain sporadic meteors. Since the radiant height of the Arietids is highest at 9h UT, the sporadic and the Arietids should overlap to a more or less broad maximum at this time. Surprisingly, the bars in Figure 2a and the blue (large) echoes in Figure 3 show local maxima at about 12h UT, when there should not be a maximum at that time. An explanation for the maxima is given.
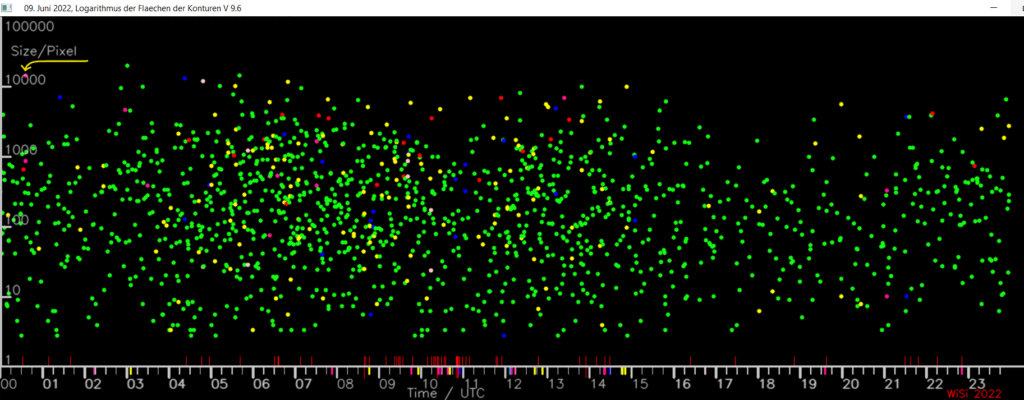
Figure 1 – Measured meteor sizes as a function of the time recorded on June 9. Each point represents an echo. 1461 echoes where logged. The program saves the echo sizes for further analysis in an intermediate file. A graphical representation of a relatively large example echo represented by the purple dot at the yellow arrow is shown in Figures 11 and 12 as an example.
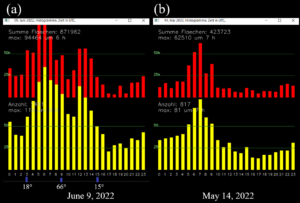
Figure 2 – (a) The yellow histogram shows the rate and the red histogram shows the rate weighted by the sizes of the meteors of June 9. Three radiant heights of Aries are indicated. The radiant was estimated using Stellarium Web (3) for Dijon in France, located close to the GRAVES radar. (b) The histogram shows the rates of May 14 as an example for comparison, which contains mostly sporadic meteors. The maximum of the sporadic meteors occurs if the position of the observer on earth is in the direction of flight. Then most of the meteors are collected, like insects are collected on a windshield.

Figure 3 –Meteor detection rate for different echo sizes over about 10 days in June 2022. The blue lines represent the rate of large echoes (1k-100k pixels), the purple line shows the medium sized echos (100 to 1k) and the yellow line shows the small echoes (below 100 pixels). Finally, the green curve shows the rate of all sizes summed up. Large echoes (blue) show maxima at around 12h UT, while small echoes (yellow) show a different behavior.
-
Setup
In order to measure the meteor echoes, I observe the GRAVES frequency 143.05 MHz. My main interest is studying the influence of the ionosphere on meteor echos. Therefore I use two almost identical receiving systems. They differ only in the antennas: They are a right hand circularly polarized 4-Element Cross-Yagi and a left hand circularly polarized 5-Element X-Quad. The antennas are mounted in the attic, so that the configuration can be easily changed. In addition, on June 19 I recorded the echoes for control purposes with a vertically polarized discone antenna. Low-noise preamplifiers with a frequency range of 140-150 MHz and a noise figure of 0.25 dB are connected directly to the phase lines of the antennas. The receivers are Icom IC-R8600. Spectrum-Lab2 (SL) serves as the recording software. SL generates plots every 20 seconds with the appropriate date and time in the file name, which are evaluated later with a self-written image processing software based on Python3 and OpenCV. At the end of the paper two figures from SL and the software are shown. The histogram in Figure 3 is smoothed with a (variable) Gaussian filter over up to 11 hours, while the histograms from Figure 4 to the end are smoothed with a fixed Gaussian like filter with the coefficients 0.31, 0.74, 1.0, 0.74 and 0.31. After many tests I estimate the uncertainty on the rate to be <5%. Unless otherwise noted, data are shown from the right hand circularly polarized antenna.
-
Results and Discussion
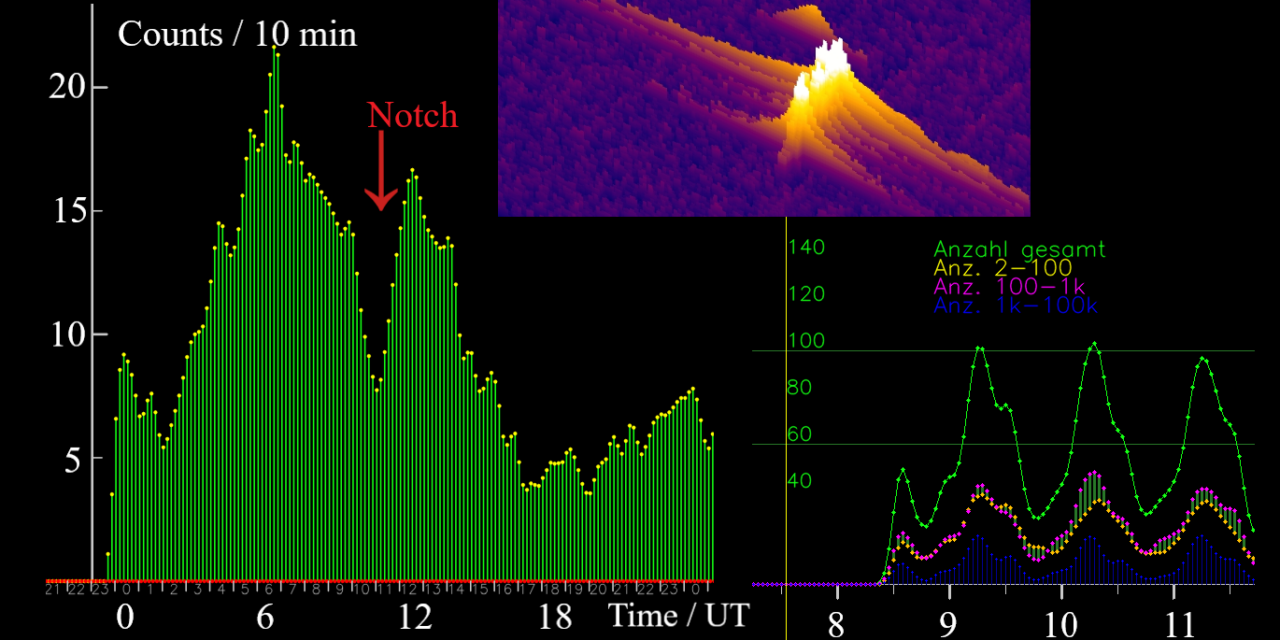
Three radiant heights of ARI are shown in Figure 2. 66° at 9h UT was the highest point. The radiant walks alongside the sun. My finding is that the measured local maximum at 12h UT is not a real maximum but that there is a notch with a minimum at 11h UT superimposing the underlying distribution. A notch was earlier documented by Verbelen (Verbelen 2019). Figure 4 shows a ten-minute histogram from three days. The relevant notches are marked. In Figure 5, the echoes from the right hand circularly polarized and the left hand circularly polarized antennas from June 9 and June 10 are plotted for comparison purposes. While there are differences, the notches are reproduced by both systems.
The data could be explained by the following hypothesis: The meteors appear from the direction of the sun. GRAVES emits its main lobe in opposite direction to the south. My receiving system is located in the north of GRAVES. When the radiant passes in front of the transmitting antenna, a meteor trail will eventually run in the direction of the radar beam. Then the ionized area that reflects the radio waves is smaller than when the trail is hit more from the side. Statistically distributed, less signal is received if the flight direction is more in the direction of the beam. The optimal cancellation or the minimum of the notch occurs when the radar direction and the direction of flight are in a line. The large echoes are particularly affected: As can be seen from the hourly histogram in Figure 2a, the red bars, the size-weighted rate, have decreased more than the yellow bars, which represent the rates. Furthermore, the large echoes, shown as blue trace in Figure 3, show maxima or at least shoulders around 12h UT, while the small echoes, shown as yellow trace, often show no dip. Small meteors should be affected by this effect only a little bit or not at all because it does not matter if they are lit from the front or from the side. To confirm this, I plotted the small echoes (< 30 pixels), intermediate sized ones (< 100 pixels) and large echoes (up to 100000 pixels) separately, see Figures 6 and 7. The plots confirm, that only the large echos cause the dip. Sometimes the small echoes even show an increase at the notch, see Figure 7, for example. This is probably because large echoes look like small ones when viewed straight ahead. This effect is somewhat more pronounced with the right hand circularly polarized antenna than with the left hand circularly polarized antenna, see Figure 6 compared with Figure 7.
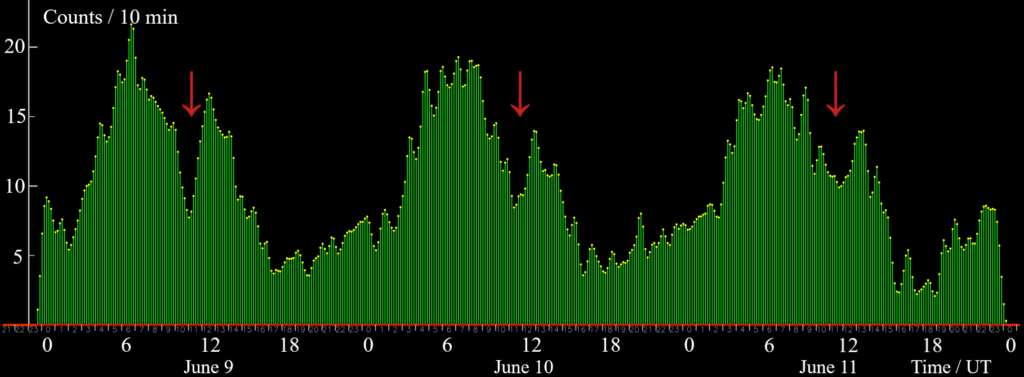
Figure 4 – The meteor detection rate in bins of ten minutes over three days clearly shows notches at about 11h UT.
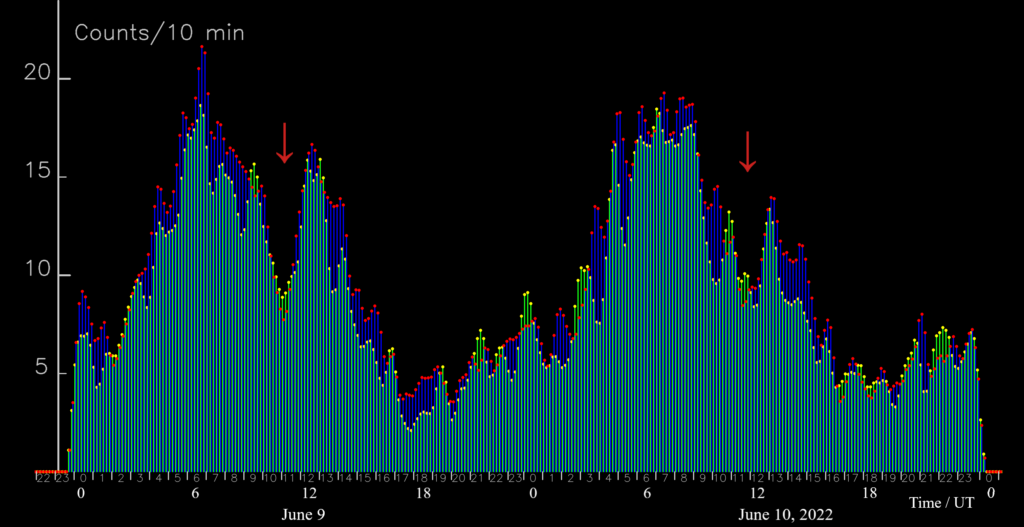
Figure 5 – The meteor detection rate recorded with two different antennas. The histogram with the red dots and blue lines is from the right hand circularly polarized antenna Cross Yagi, the histogram with the yellow dots and green lines is from the left hand circularly polarized X-Quad antenna. While there are differences, the notches are reproduced by both systems, see the red arrows.
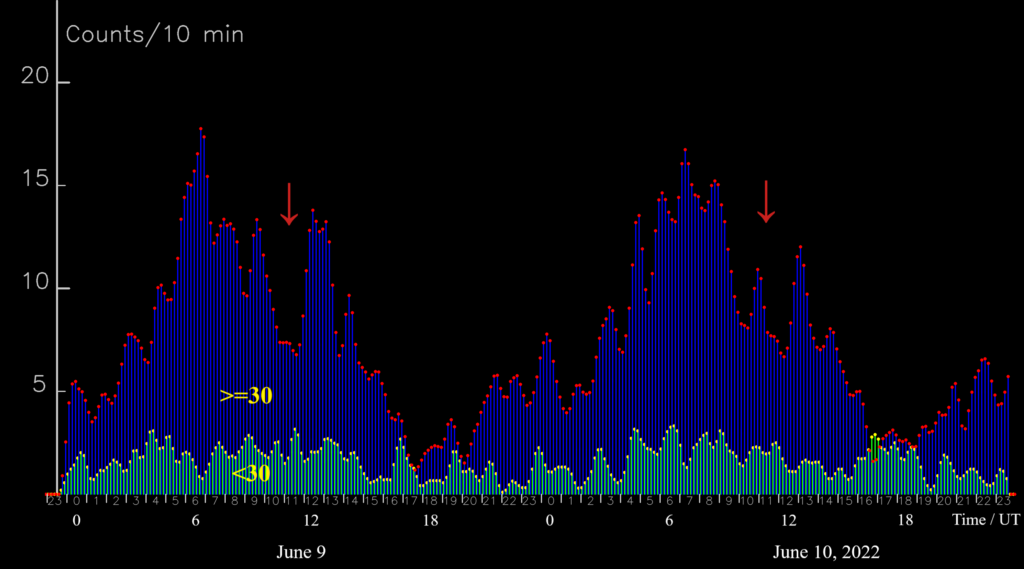
Figure 6 – Meteor detection rate for small echoes (<30 pixel) and large ones (>=30 to 100k pixels). Only the rate of large echoes exhibits dips. No notch is observed in the detection rate of small echoes at the dip. The data are from the left hand circularly polarized antenna.
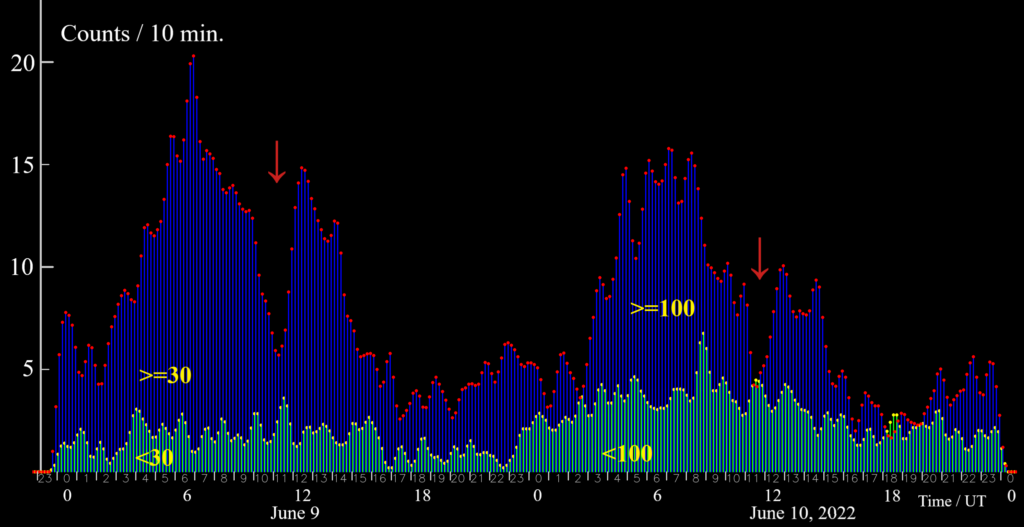
Figure 7 – Meteor detection rate for small echoes (<30 or < 100 pixel) and large ones (>=30 or >=100 to 100k pixels). The data are from the right hand circularly polarized antenna. The small echoes show an increase at the notch, see text. Basically, it makes no difference whether the threshold is 30 or 100 pixel.
Rate and size-weighted rate have notches of different widths.
In Figure 8 the rate and the rate weighted by the sizes of June 9 and June 10 are shown in bins of ten minutes. The notch of the size-weighted rate is much wider than the notch of the rate. In theory, the rate shouldn’t have a notch because the numbers don’t change as the radiant passes in front of the antenna. Only the sizes change due to the changing the viewing angle. However, if the echoes are too small when viewed from an acute angle, they fall below the threshold. A result is the dip of the rate, however with a different width. This behavior fits perfectly with the hypothesis discussed here. Furthermore the image shows a nice detail, the peak at the bottom of the notch of the size-weighted rate, see the yellow arrow. This peak is small, but belongs probably to the effect discussed above. It was also seen in Geminids 2021 data. The Geminids data are not shown here because it would go beyond the scope of this article, but will be reexamined in December.
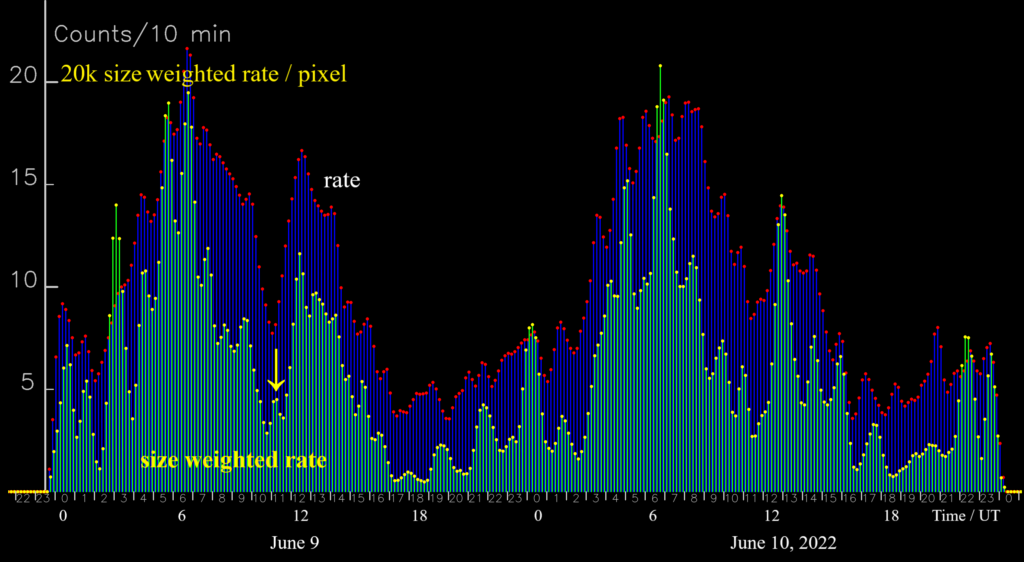
Figure 8 – Histograms of the rate and of the size-weighted rate have notches of different widths, shown in bins of ten minutes of June 9 and June 10. This is the case in all cases examined. The peak at the yellow arrow is probably due to the postulated In-Line-Effect, see text.
Test with a Discone antenna
On June 19 I recorded for control purposes the echoes with a vertically polarized discone antenna. Because of the less sensitive discone and because ARI is decreasing, the notch is weak. However both the notch in the large echoes and the local maximum of the small echoes are clearly visible, see Figure 9.
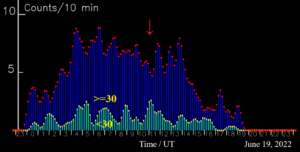
Figure 9 – Comparison of the small echoes with the large ones on June 19. Due to the less sensitive discone and the decreasing ARI, the notch is weak. The peak and the notch are indicated by the red arrow.
The so called In-Line-Effect
The increase in small echoes is somewhat reminiscent of the opposition effect. I will call it the In-Line-Effect. The opposition effect (also Seeliger effect) in visual optics works of course differently. Figure 10 shows the shadow of my copter on a grain field. In the direction of the rays of the sunlight and the line of sight, the culms cover their own shadow, so that a light stripe is created for the viewer who is exactly on the line. Further outwards, the shadows become visible again and the image becomes darker as a result. In both cases, the observed objects hide something: the culm hides its shadow, the head of the meteor hides its trail. This comparison also explains that statistical effects are involved in both cases. Future investigations will have to show why and whether echoes are amplified by the in-line arrangement.
The sporadic meteors are also affected, of course, but it is not visible. Overall, however, the effects leads to an underestimation of the sporadic meteors and of the streams.

Figure 10 – The image shows the shadow of my copter on a crop field and bright areas around it caused by the opposition effect. The contrast of the image is enhanced.
What does the software look like?
Finally, I would like to show how the spectrograms and the program look like: Figure 11 is an original output from Spectrum Lab and Figure 12 shows how the evaluation software sees the echoes. Two differently sized echoes are recognized and the sizes are determined.
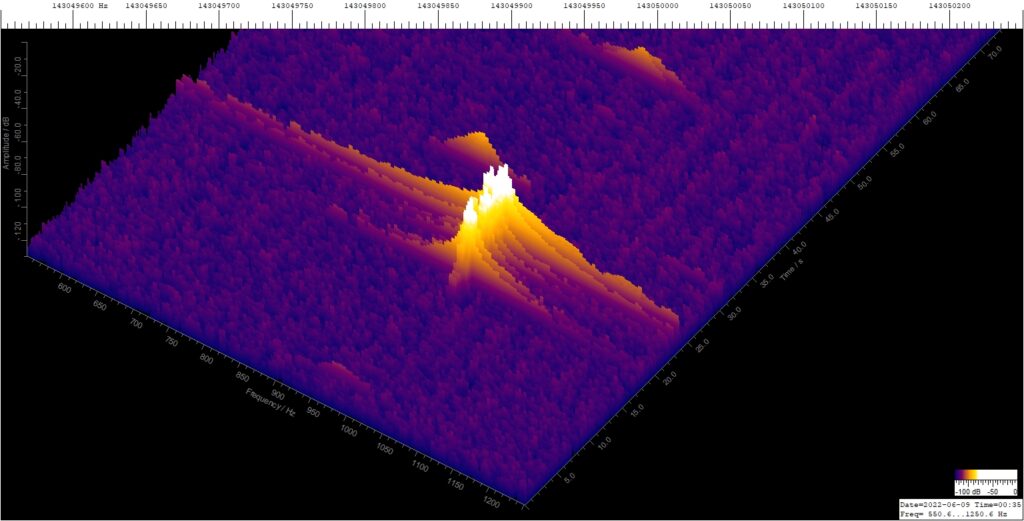
Figure 11 – Original Spectrum Lab output from 00:35h UT on June 9, 2022. Three echoes (above the threshold) are visible.

Figure 12 – Screenshot of the evaluation software output in debug mode. Only two echoes instead of three from Figure 11 are being detected because they fall within the 20-second evaluation window. This area is divided into five sections. Echoes can be detected separately in each section. If multiple echoes or fragments fall within one of the five 4-second ranges, they are summed up as one echo. The large echo is indicated in Figure 1. Finally, the values are saved in an intermediate file, see the inset.
Acknowledgment
Many thanks to Eva for the proofreading.
Reference
Verbelen F. (2019). “Meteor velocity derived from head echoes obtained by a single observer using forward scatter from a low powered beacon”. WGN, Journal of the International Meteor Organization, 47:2, 49–54




These are nice radio meteor observations. Introducing new ideas and techniques in radio meteor observation always is highly welcome. In this study the rectangular area around the reflected radio signal in the frequency domain is taken as a measure of the size (or mass) of the meteor. Commonly, max. signal power and the duration of a signal are taken as indicators only. The presented area-method overestimates the frequency span of the signal and underestimates the signal power thereby introducing a significant error: there exist radio signals containing head echoes showing a broad frequency span due to Doppler shift and trail reflections with only small frequency spans caused by Doppler shift due to high winds, moving the trail. Meteoroids with the same mass will produce different rectangular areas depending on the reception of a head echo or the trail reflection only or both together.
The reception of a head echo depends on its mass (the bigger the larger the radar cross section of the surrounding plasma sheath) and its trajectory in relation to transmitter and receiver. This determines the amount of Doppler shift, that can exceed +/- 50 kHz. Such shifts during the ablation phase on the meteoroids flight are lying outside normal receiver bandwidths and are therefore not registered. This must be taken into account explaining the observed notches (see http://www.ars-electromagnetica.de/robs/Media/WGN48-1-Offprint-Kaufmann.pdf)
By the way, GRAVES special radar operation makes analysis even more complicated: The four beams of GRAVES radar stepwise rotate periodically whereby each switching of the phased antenna array emits a short broad frequency pulse. This can be seen well in the presented spectra and broadens the rectangular area in an unpredictable way.
Again, nice work but be careful with interpretation of what you have measured.
Hello Wolfgang,
thank you for your answer and your literature. Notches are probably not a problem. Notches have also been recorded from other stations, see e.g. the Geminid data by Rainer Ehlert on RMOB on December 14 at 8h UT. https://www.rmob.org/visual/2021/ehlert_122021rmob.txt
According to Felix Verbelen notches occur in almost all important streams.
I am aware that the way the size is determined causes errors, but I have to start somewhere.
The light yellow contour in Figure 12 is evaluated for the size of the echoes, not one of the rectangles. The corners are only for triggering. The glitches caused by the Fourier transform are roughly proportional to the size of the echo. The type of projection then ultimately creates an image that reflects the sizes in a first approximation. As can be seen in Figure 1, the sizes of the echoes are fairly evenly distributed over the entire range from 2 to 12000 pixels. With the large echoes, the error is of course larger. When examining the in-line effect, only small echoes play a role. Here the error should be smaller. Also, I take up to three antennas with different polarization that deliver different sizes. This is also to avoid misinterpretations. As described in the paper, I observe a maximum of the rate of small echoes at the minimum of the notch. Depending on the method, the peak at the notch is longer than 20 minutes. I currently think that effects caused by switching the antennas are eliminated by the statistics. I would appreciate more observers looking for this effect.
Best regards,
Wilhelm