Ivan Sergei
Mira Str.40-2, 222307, Molodechno Belarus
seriv76@tut.by
Abstract: This article presents the results of radio observations made in July 2021. The results of the radio observations are compared with the CAMS video network summaries.
1 INTRODUCTION
The observations were carried out at a private astronomical observatory near the town of Molodechno (Belarus) at the place of Polyani. A 5 element-antenna directed to the west was used, a car FM-receiver was connected to a laptop with as processor an Intel Atom CPU N2600 (1.6 GHz). The software to detect signals is Metan (author – Carol from Poland). Observations are made on the operating frequency 88.6 MHz (the FM radio station near Paris broadcasts on this frequency). The “France Culture” radio broadcast transmitter (100 kW) I use is at about 1550 km from my observatory which has been renewed in 1997.
2 Automatic observations
There are no main showers in July, so the activity of meteors is more or less uniform. Three waves of activity can be seen on the graph. The first is until July 10–11, the second from July 12–24, and the third from July 25-31. The peak in the third wave may be the combined activity of SDA (#0005), CAP (#0001), GDR (#0184) (Rendtel, 2020).
Figure 1 shows the hourly rates of radio meteors in July 2021 at 88.6 MHz. Figure 2 shows the corresponding heat map.
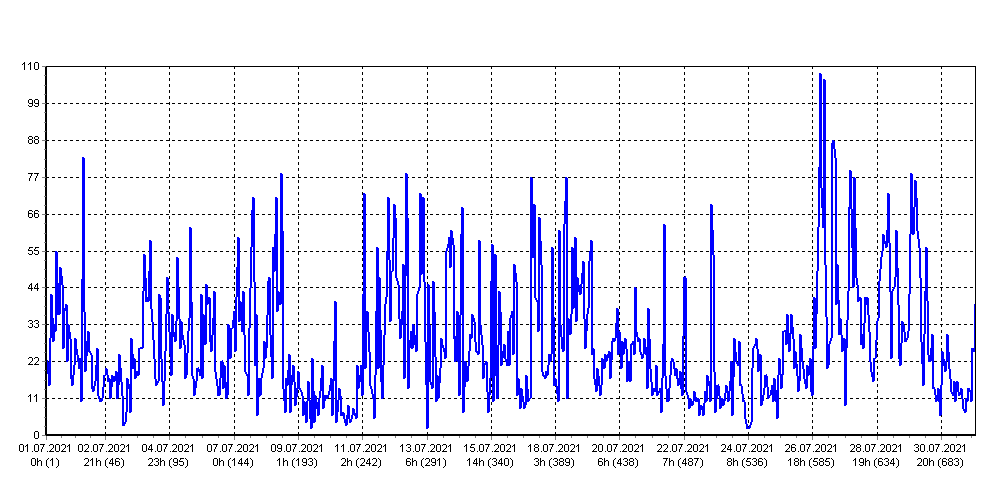
Figure 1 – Radio meteor echo counts at 88.6 MHz for July 2021.
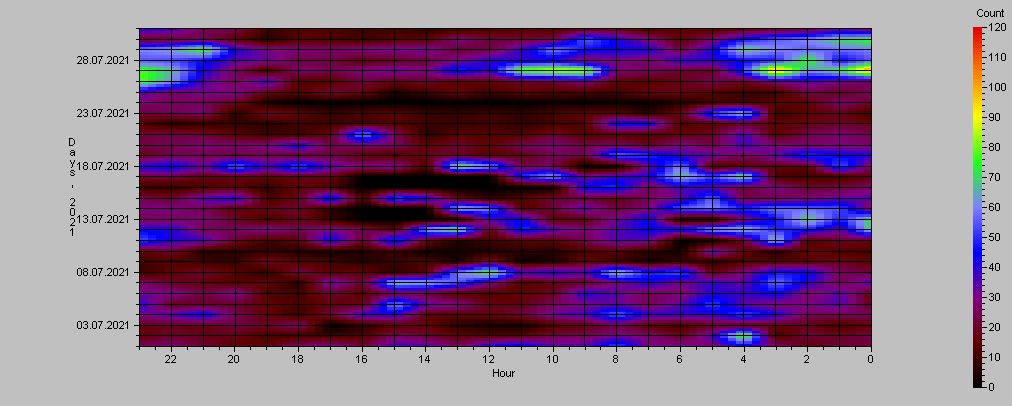
Figure 2 – Heatmap for radio meteor echo counts at 88.6 MHz for July 2021.
3 Listening to radio echoes on 88.6 MHz
Listening to the radio signals 1 to 3 times a day for one hour was done in order to control the level of the hourly rates, as well as to distinguish between periods of tropospheric passage and other natural radio interference. The total effective listening time was 63 hours.
The radio listening method shows three waves of meteor signal activity during the month. The first wave until July 11, the second from July 12 to 24, and the third from July 25 to 31. The peak on the third wave may be the combined activity of SDA (#0005), CAP (#0001), GDR (#0184).
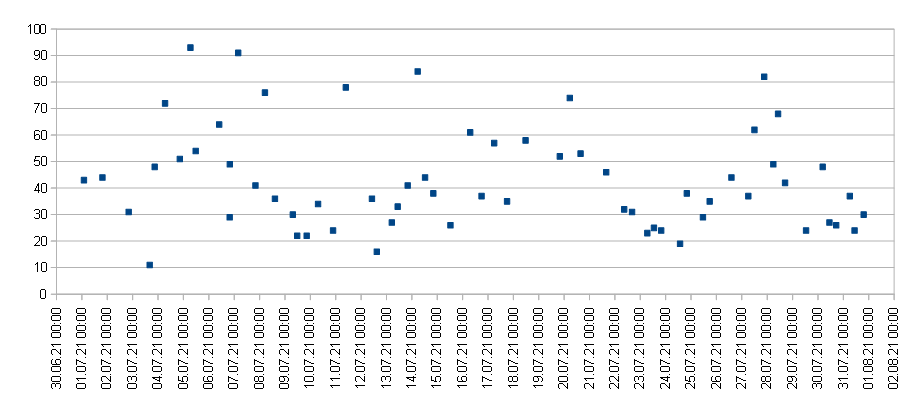
Figure 3 – The result with the calculated hourly numbers of echoes of meteors by listening to the radio signals for July 2021.
4 Fireballs
In order to quickly search for signals of the radio fireballs, the program SpectrumLab was running in parallel to the Metan program. Screenshots were saved every 10 minutes. The search for fireball events was performed visually by viewing many thousands of screenshots obtained over a month. Then, we selected fireball events from the log files of the Metan program. For fireball activity statistics, I have selected signals from the log files with a peak power greater than 10000 as fireballs and with a signal duration greater than 10 seconds. Figure 4 shows the daily activity of the fireball radio signals. Figure 5 displays one of the fireball radio echoes.
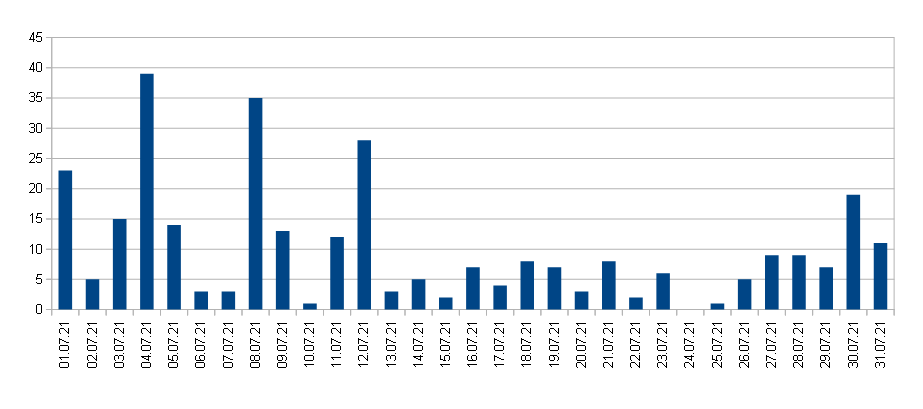
Figure 4 – Daily activity of radio fireballs in July 2021.
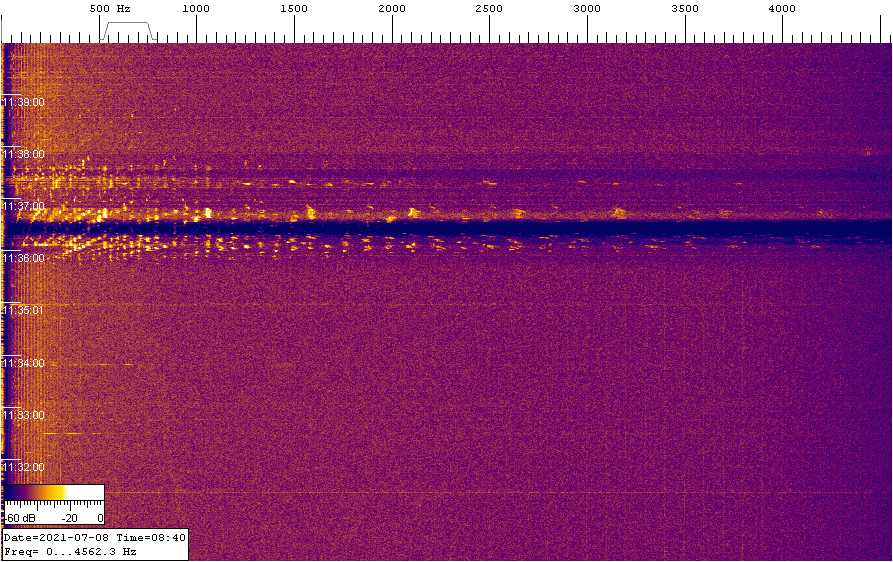
Figure 5 – Radio fireball recorded by SpectrumLab on July 08 at 08h37m UT.
There is no known source of increased fireball activity in the first half of the month.
5 CAMS Data
Figure 6 shows the total daily activity of meteors from the CAMS video network data (Jenniskens et al., 2011). There is a noticeable correlation between the activity level of sporadic meteors and the activity level of shower meteors. At the end of the month, the total activity of shower meteors exceeded the activity of the sporadic background.
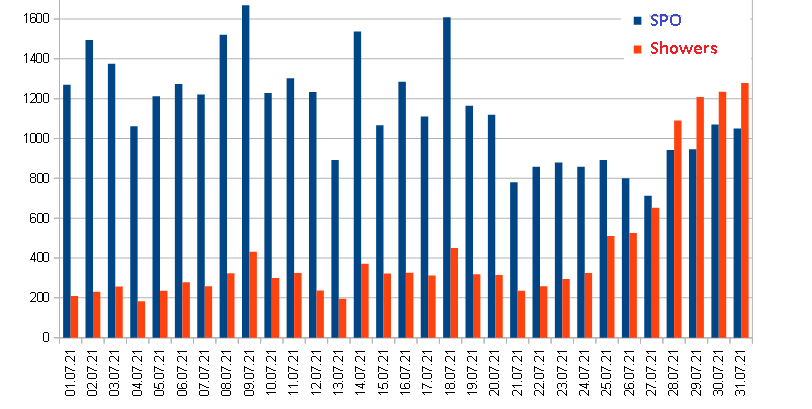
Figure 6 – Daily video meteor activity in July 2021 according to CAMS video networks.
On July 9, the Northern June Aquilids NZC (#0164) and Southern June Aquilids SZC (#0165) complex had a cumulative maximum of activity. The July 18 activity peak is a result of the combined activity of the most active minor showers xi2 Capricornids XCS (#0623), kappa Perseids KAP (#0547), and several others. The sharp increase in meteor shower activity at the end of the month is primarily due to SDA (#0005), CAP (#0001), and PER (#0007).
6 Conclusion
There is a satisfactory correlation between the methods of automatic signal detection and the method of listening to the radio echoes by manual counting of the number of meteor signals. The counting method and the automatic detection method show a three-wave profile of activity during the month of July. Such activity fluctuations are poorly visible in the CAMS data, which may indicate that this monthly activity fluctuations are caused by smaller meteoroids, hence fainter meteors. The level of shower activity according to CAMS data increases by about 2 times by the end of the month, while the level of activity in the radio band does not increase that much. The poor correlation between video-network data and radio-observations is related to the detection of meteoroids of different masses. Most likely a huge abundance of small particles during the radio observations does not allow to detect the activity profile for larger meteoroids which are registered by video networks as these are predominated by the majority of smaller dust.
Acknowledgment
I would like to thank Sergey Dubrovsky for the software he developed for data analysis and processing of radio observations (software Rameda). I thank Carol from Poland for the Metan software. Thanks to Paul Roggemans for his help in the lay-out and the correction of this article.
References
Rendtel J. (2020). “Meteor Shower Calendar”. IMO.
Jenniskens P., Gural P. S., Dynneson L., Grigsby B. J., Newman K. E., Borden M., Koop M., Holman D. (2011). “CAMS: Cameras for Allsky Meteor Surveillance to establish minor meteor showers”. Icarus, 216, 40–61.