Ivan Sergei
Mira Str.40-2, 222307, Molodechno Belarus
seriv76@tut.by
Abstract: This article presents the results of radio observations made in May 2021. The results of the radio observations are compared with the CAMS video network summaries.
1 INTRODUCTION
The observations were carried out at a private astronomical observatory near the town of Molodechno (Belarus) at the place of Polyani. A 5 element-antenna directed to the west was used, a car FM-receiver was connected to a laptop with as processor an Intel Atom CPU N2600 (1.6 GHz). The software to detect signals is Metan (author – Carol from Poland). Observations are made on the operating frequency 88.6 MHz (the FM radio station near Paris broadcasts on this frequency). The “France Culture” radio broadcast transmitter (100 kW) I use is at about 1550 km from my observatory which has been renewed in 1997.
2 Automatic observations
High signal activity was recorded from 6 to 8:30 UT on May 7, 2021. This activity can be classified as belonging to ETA (#031) (Rendtel, 2020). Three waves can be distinguished on the general graph of activity: May 1-12, May 12-19, and May 19-30. Weak daily showers DEA (#154) maximum May 9, DCE (#293) maximum May 20, DMA (#294) maximum May 16, do not stand out against the general background of signal activity.
Figure 1 shows the hourly rates of radio meteors in May 2021 at 88.6 MHz. Figure 2 shows the corresponding heat map.
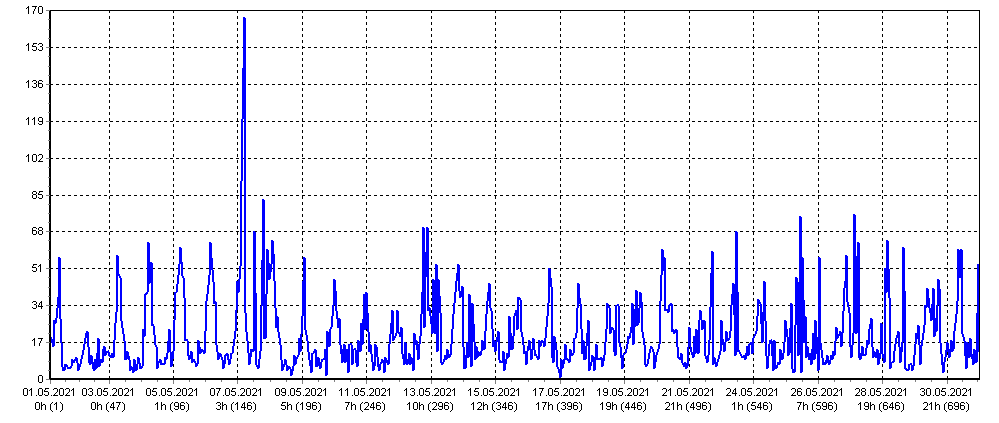
Figure 1 – Radio meteor echo counts at 88.6 MHz for May 2021.
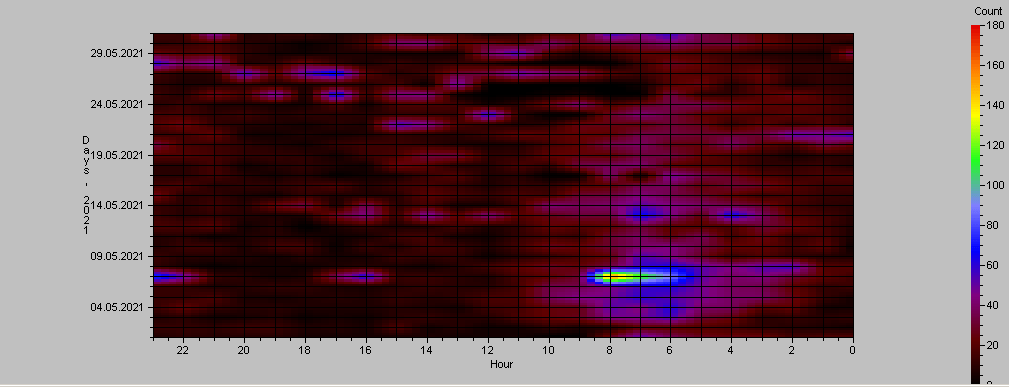
Figure 2 – Heatmap for radio meteor echo counts at 88.6 MHz for May 2021.
3 Listening to radio echoes on 88.6 MHz
Listening to the radio signals 1 to 3 times a day for one hour was done in order to control the level of the hourly rates, as well as to distinguish between periods of tropospheric passage and other natural radio interference. The total effective listening time was 67 hours. Conditionally, the month can be divided into 3 waves of activity: May 1-12, the second May 13-22, and the third May 22-30. The first wave of activity is associated with ETA (#031).
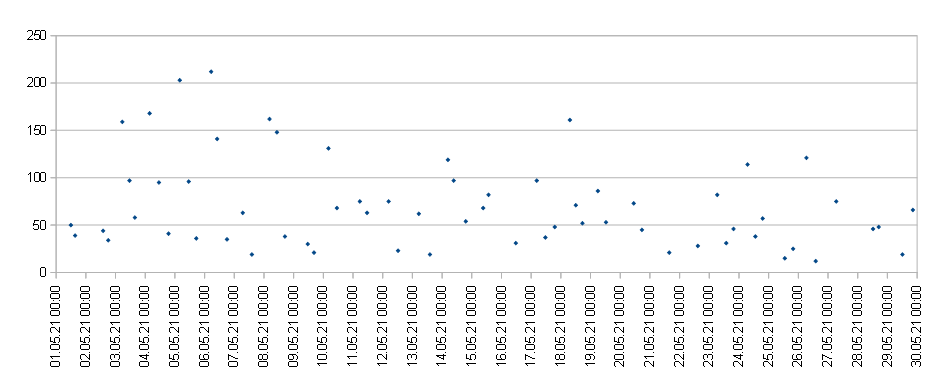
Figure 3 – The result with the calculated hourly numbers of echoes of meteors by listening to the radio signals for May 2021.
4 Fireballs
In order to quickly search for signals of the radio fireballs, the program SpectrumLab was running in parallel to the Metan program. Screenshots were saved every 10 minutes. The search for fireball events was performed visually by viewing many thousands of screenshots obtained over a month. Then, we selected fireball events from the log files of the Metan program. For fireball activity statistics, I have selected signals from the log files with a peak power greater than 10000 as fireballs and with a signal duration greater than 10 seconds. Figure 4 shows the daily activity of the fireball radio signals.
Figure 5 displays one of the fireball radio echoes. For technical reasons, SpectrumLab screenshots were not saved from May 27 to 31.
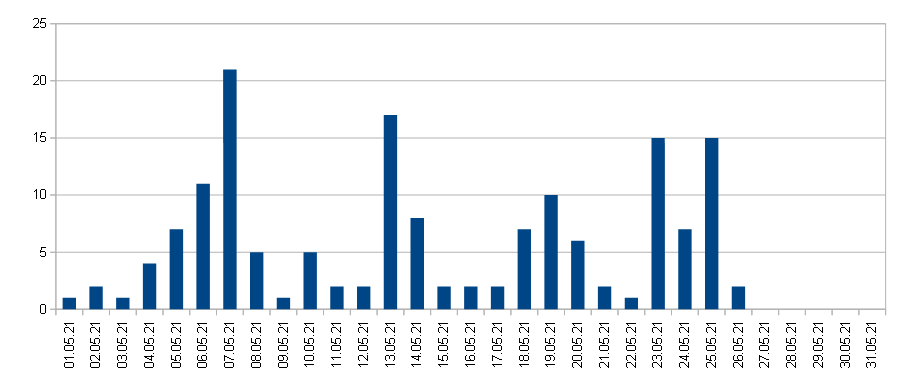
Figure 4 – Daily activity of radio fireballs in May 2021.
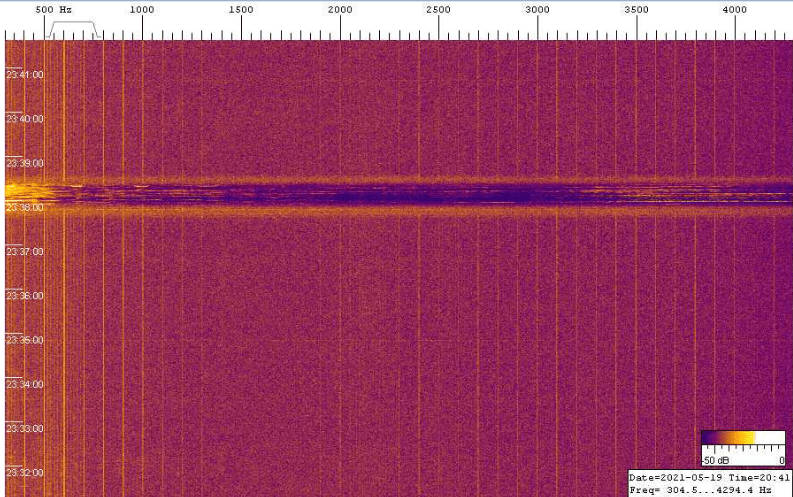
Figure 5 – Radio fireball recorded by SpectrumLab on May 19 at 20h38m UT.
5 CAMS Data
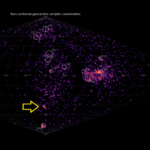
Figure 6 shows the total daily activity of meteors from the CAMS video network data (Jenniskens et al., 2011). There is a noticeable correlation between the activity level of sporadic meteors and the activity level of shower meteors.
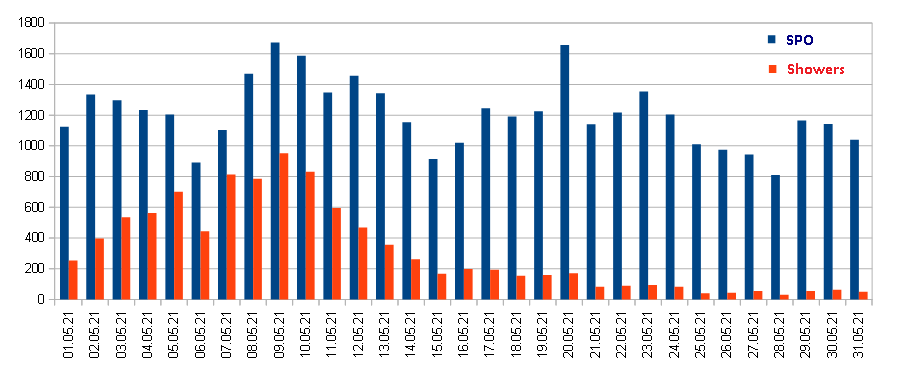
Figure 6 – Daily activity meteors of video networks CAMS in May 2021.
6 Conclusion
There is a satisfactory correlation for the data obtained by the automatic method of observation, the method of listening to the radio echoes and CAMS video observation data. Some discrepancy in the time of the ETA (#031) peak activity according to the two methods can be explained by the fact that the listening method is more sensitive than the automatic detection method. The Metan software is poor at detecting very weak signals at the detection threshold. Both methods show 3 waves of meteor signal activity within a month. CAMS data shows the peak eta Aquariids (ETA#031) on May 9, not in agreement with the IMO meteor calendar. Probably IMO data is outdated and needs to be updated.
Acknowledgment
I would like to thank Sergey Dubrovsky for the software he developed for data analysis and processing of radio observations (software Rameda). I thank Carol from Poland for the Metan software. Thanks to Paul Roggemans for his help in the lay-out and the correction of this article.
References
Rendtel J. (2020). “Meteor Shower Calendar”. IMO.
Jenniskens P., Gural P. S., Dynneson L., Grigsby B. J., Newman K. E., Borden M., Koop M., Holman D. (2011). “CAMS: Cameras for Allsky Meteor Surveillance to establish minor meteor showers”. Icarus, 216, 40–61.