Ivan Sergei
Mira Str.40-2, 222307, Molodechno Belarus
seriv76@tut.by
Abstract: This article presents the results of radio observations made in April 2021. The results of the radio observations are compared with the CAMS video network summaries.
1 INTRODUCTION
The observations were carried out at a private astronomical observatory near the town of Molodechno (Belarus) at the place of Polyani. A 5 element-antenna directed to the west was used, a car FM-receiver was connected to a laptop with as processor an Intel Atom CPU N2600 (1.6 GHz). The software to detect signals is Metan (author – Carol from Poland). Observations are made on the operating frequency 88.6 MHz (the FM radio station near Paris broadcasts on this frequency). “The “France Culture” radio broadcast transmitter (100 kW) I use is at about 1550 km from my observatory which has been renewed in 1997.
2 Automatic observations
There are no active visual or daylight meteor showers in April (Rendtel, 2020). The average approximate background hourly signal activity is 3–15. Figure 1 shows the hourly rates of radio meteors in April 2021 at 88.6 MHz. Figure 2 shows the corresponding heat map.
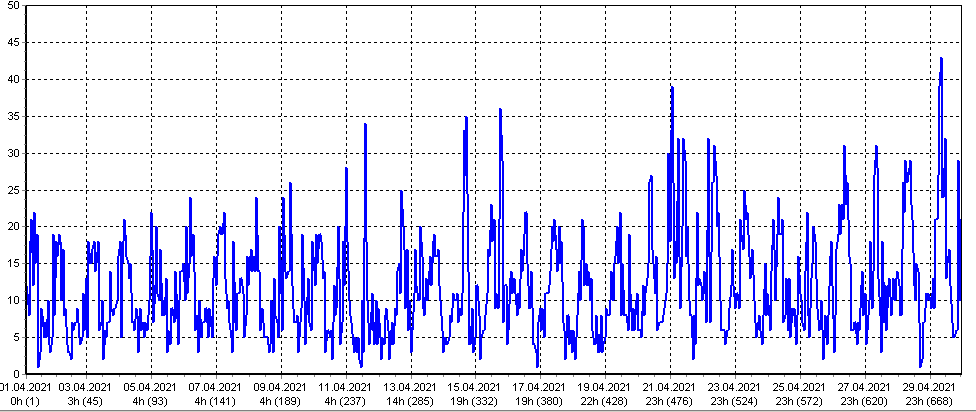
Figure 1 – Radio meteor echo counts at 88.6 MHz for April 2021.
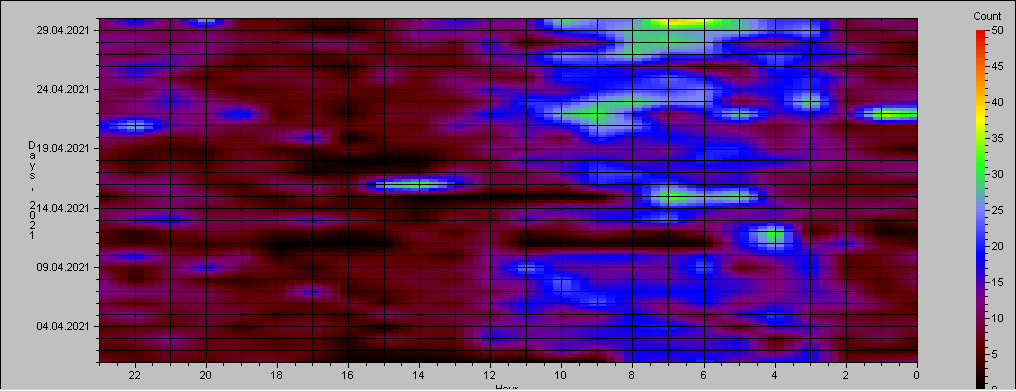
Figure 2 – Heatmap for radio meteor echo counts at 88.6 MHz for April 2021.
Lyrids (#0006) activity has been weakly detected by the automatic method of observation. The maximum of activity could occur between 00h–10h UT on April 22, 2021. According to the IMO calendar, the calculated Lyrid peak should occur on April 22 around 13h UT. For this time, the radiant does not fall within the antenna pattern, as it is located “below the horizon”. The maximum activity of the daily meteor shower APS (#0144), according to the IMO calendar, occurs on April 22. It is impossible to isolate this maximum and to separate it from the Lyrid maximum. The graph of daily activity shows the total activity of all showers.
3 Listening to radio echoes on 88.6 MHz
Listening to the radio signals 1 to 3 times a day for one hour was done in order to control the level of the hourly rates, as well as to distinguish between periods of tropospheric passage and other natural radio interference. The total effective listening time was 58 hours.
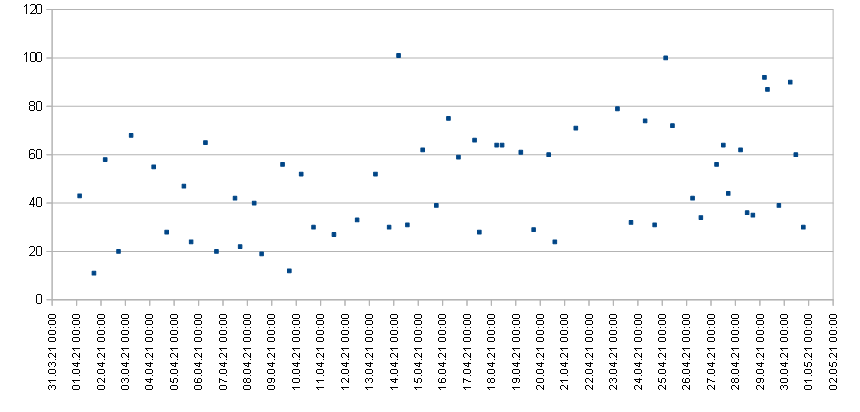
Figure 3 – The result with the calculated hourly numbers of echoes of meteors by listening to the radio signals for April 2021.
The activity graph by the listening method shows 4 waves of activity. The total activity increases monotonically during the month. The 1st wave is from April 1 to 10, the second from April 11 to 19, the third from April 20 to 27, and the fourth is short after April 27. The Lyrid maximum is not clearly visible, the maximum hourly numbers are about 80 echoes per hour.
4 Fireballs
In order to quickly search for signals of the radio fireballs, the program SpectrumLab was running in parallel to the Metan program. Screenshots were saved every 10 minutes. The search for fireball events was performed visually by viewing many thousands of screenshots obtained over a month. Then, we selected fireball events from the log files of the Metan program. For fireball activity statistics, I have selected signals from the log files with a peak power greater than 10000 as fireballs and with a signal duration greater than 10 seconds. Figure 4 shows the daily activity of the fireball radio signals.
Daily activity of fireballs did not exceed 4, indicating a “quiet” month in terms of activity. Figure 5 displays one of the fireball radio echoes.
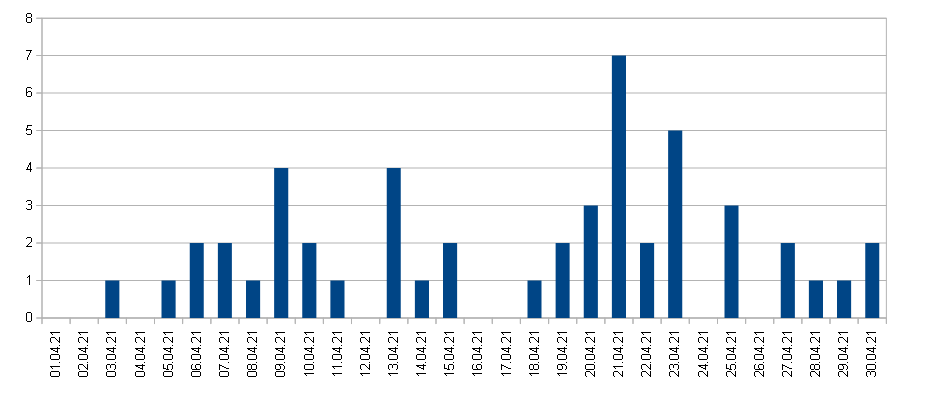
Figure 4 – Daily activity of radio fireballs in April 2021.
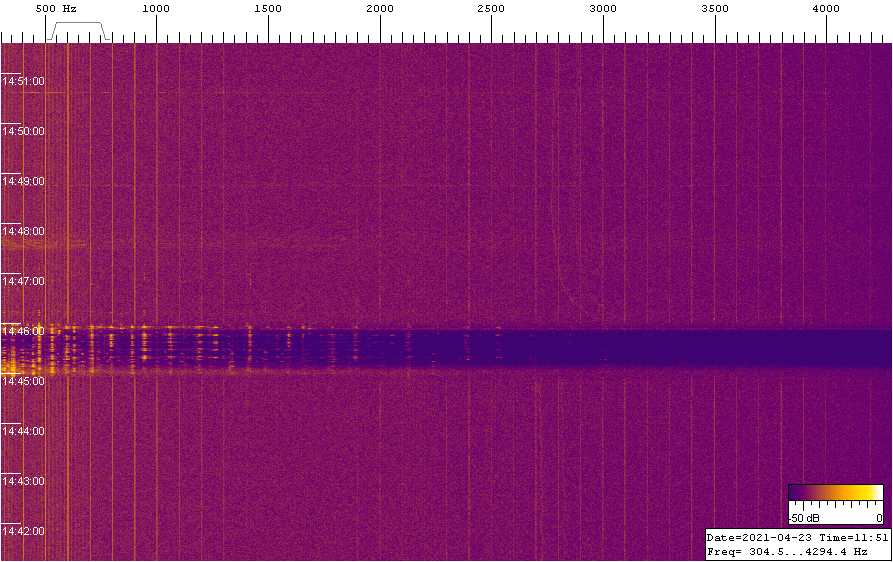
Figure 5 – Radio fireball recorded by SpectrumLab on April 23 at 11h45m UT.
5 CAMS Data
Figure 6 shows the total daily activity of meteors from the CAMS video network data (Jenniskens et al., 2011). There is a noticeable correlation between the activity level of sporadic meteors and the activity level of shower meteors.
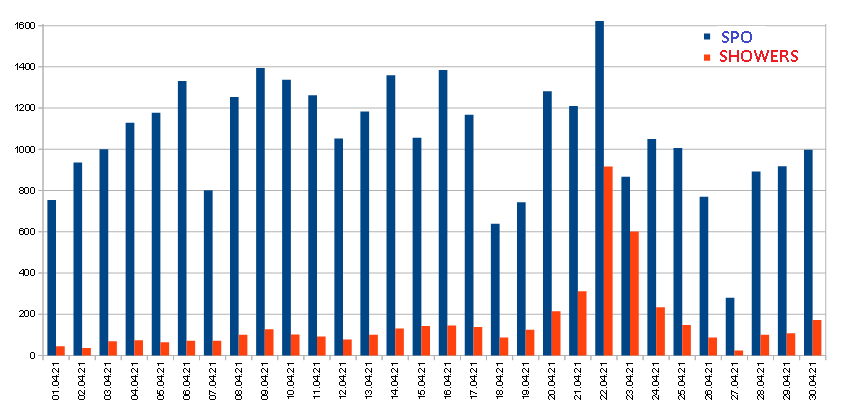
Figure 6 – Daily video meteor activity in April 2021 according to CAMS video networks.
A correlation between the activity level of sporadic meteors and showers can be seen on the graph. The maximum of Lyrid and sporadic meteor activity occurs on April 22. This can be explained by the fact that there is no exact boundary between sporadic and shower meteors.
6 Conclusion
The graph of radio fireballs activity has some correlation with the graph of the CAMS video meteors. Thus, on April 9, according to CAMS, there is a weak increase in the meteor shower activity, at which time there is a weak peak of radio fireballs. The increase in meteor shower activity in the CAMS data was due to some increased activity of streams such as OAV (#0651), AVB (#0021), BCO (#0647), NPE (#0827), DHE (#0841).
The Lyrid meteor shower is very poorly detected by my Radio Meteor System. Meteor showers with ZHR < 18 at maximum activity are almost impossible for my Radio Meteor System to detect.
Acknowledgment
I would like to thank Sergey Dubrovsky for the software he developed for data analysis and processing of radio observations (software Rameda). I thank Carol from Poland for the Metan software. Thanks to Paul Roggemans for his help in the lay-out and the correction of this article.
References
Rendtel J. (2020). “Meteor Shower Calendar”. IMO.
Jenniskens P., Gural P. S., Dynneson L., Grigsby B. J., Newman K. E., Borden M., Koop M., Holman D. (2011). “CAMS: Cameras for Allsky Meteor Surveillance to establish minor meteor showers”. Icarus, 216, 40–61.