Ivan Sergei1
1 Mira Str.40-2, 222307, Molodechno Belarus
seriv76@tut.by
Abstract: This article presents the results of radio observations made in February 2021. The results of the radio observations are compared with the CAMS video network summaries.
1 INTRODUCTION
The observations were carried out at a private astronomical observatory near the town of Molodechno (Belarus) at the place of Polyani. A 5 element-antenna directed to the west was used, a car FM-receiver was connected to a laptop with as processor an Intel Atom CPU N2600 (1.6 GHz). The software to detect signals is Metan (author – Carol from Poland). Observations are made on the operating frequency 88.6 MHz (the FM radio station near Paris broadcasts on this frequency). “The “France Culture” radio broadcast transmitter (100 kW) I use is at about 1550 km from my observatory which has been renewed in 1997.
2 Automatic Observations
There are no active visual showers in February. According to the IMO calendar (Rendtel, 2021), the Capricornids/Sagittariids (DCS #0115) peak as daytime shower activity on February 1, the χ-Capricornids (DXC #0114) are another daytime shower and peak on February 13. These are meteoroid streams with low activity, so they could not be registered. Figure 1 shows the hourly numbers of meteors in February 2021 at 88.6 MHz.
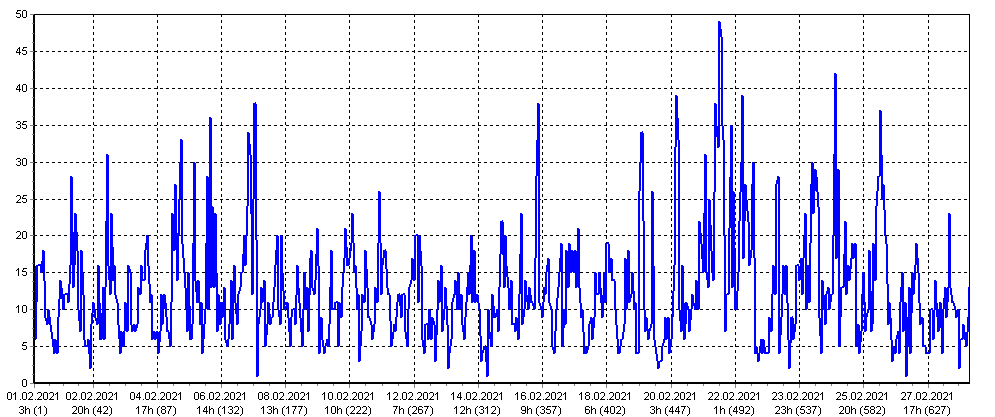
Figure 1 – Radio meteor echo counts at 88.6 MHz for February 2021.
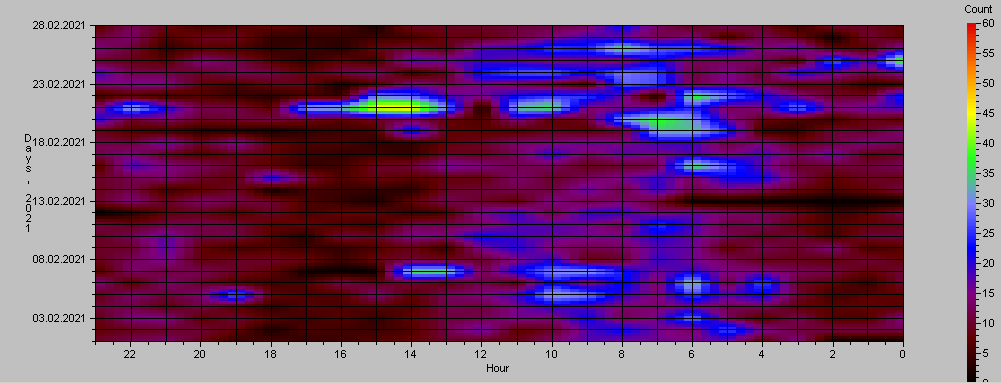
Figure 2 – Heatmap for radio meteor echo counts at 88.6 MHz for February 2021.
3 Listening to radio echoes on 88.6 MHz
Listening to the radio signals 1 to 3 times a day for one hour was done in order to control the level of the hourly activity, as well as to distinguish between periods of tropospheric passage and other natural radio interference. The total effective listening time was 78 hours. Some increase in meteor signal activity in the middle of the month can be explained by the registration of the maximum activity of the daytime meteor shower χ-Capricornids (#0114 DXC).
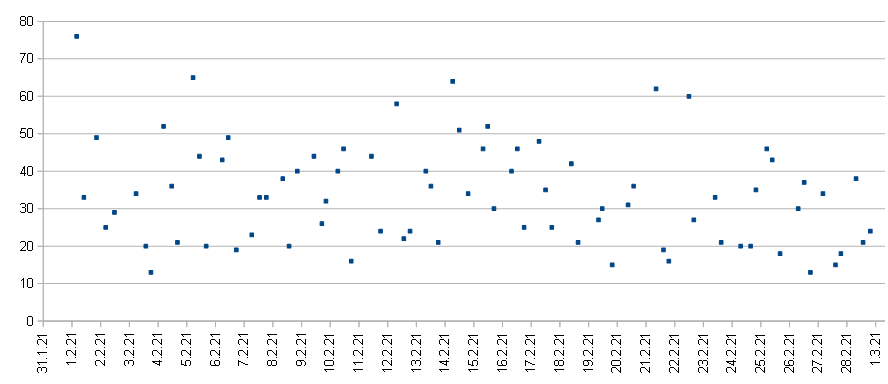
Figure 3 – The result with the calculated hourly numbers of meteor echoes by listening to the radio signals for February 2021.
The difference in activity levels between the listening method and the automatic observations can be explained by the fact that listening to the radio airwaves hears weaker meteor signals that are not available for recording by the software.
4 Fireballs
In order to quickly search for signals of the radio fireballs, the program SpectrumLab was running in parallel to the Metan program. Screenshots were saved every 10 minutes. The search for fireballs events was performed visually by viewing many thousands of screenshots obtained over a month. Then, we selected fireball events from the log files of the Metan program. For fireball activity statistics, I have selected signals from the log files with a peak power greater than 10000 as fireballs and with a signal duration greater than 10 seconds. Figure 4 shows the daily activity of the fireball radio signals. During the month we can distinguish three peaks of bolide activity: February 4–5, February 10–11, February 19–21. Sharp fluctuations in the level of radio signals generated by larger meteoroids indicates a very uneven distribution of large meteoroids in space. Figure 5 shows a typical 20.8-second radio fireball recorded by SpectrumLab on February 04 at 11h28m UT.
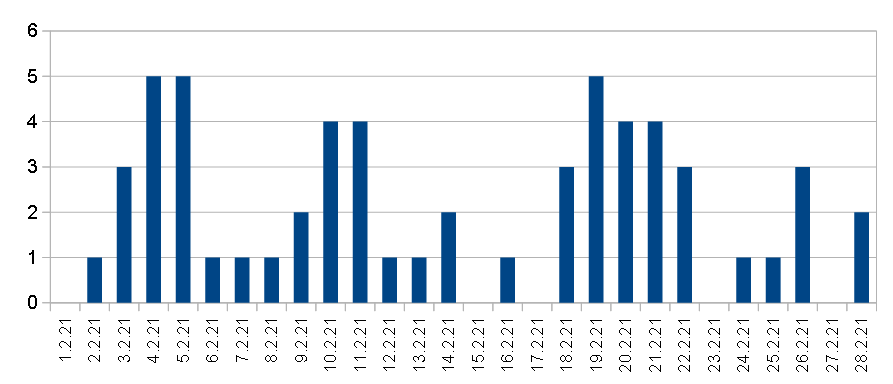
Figure 4 – Daily activity of radio fireballs in February 2021.
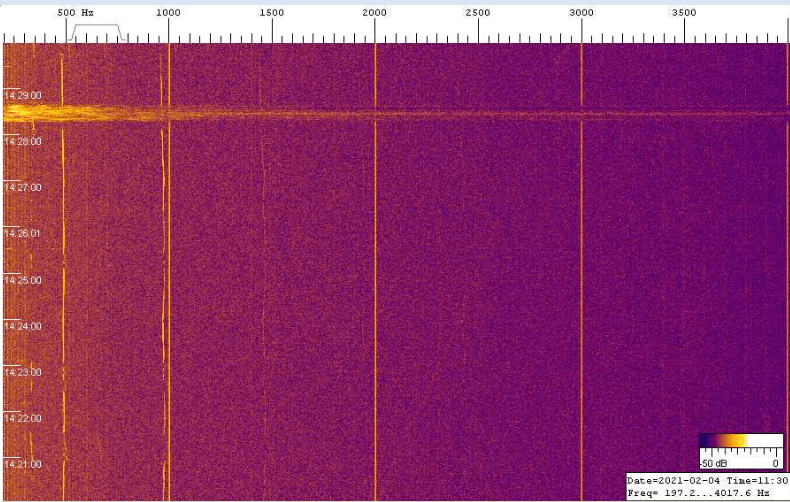
Figure 5 – Radio fireball recorded by SpectrumLab on February 04 at 11:28 UT.
5 CAMS Data
Figure 6 shows the total daily activity of meteors from the CAMS video network data (Jenniskens P., 2011). There is a noticeable correlation between the activity level of sporadic meteors and the activity level of shower meteors.
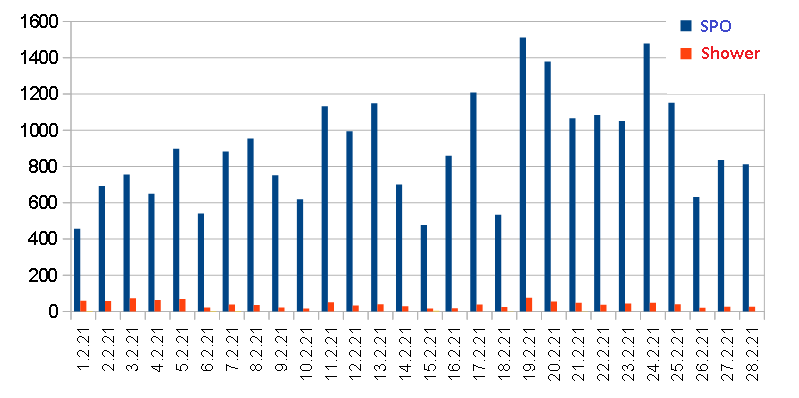
Figure 6 – Daily video meteor activity in February 2021 according to CAMS video networks.
6 Conclusion
Automated observing data show a slight increase in activity in the period February 19–26. This agrees well with the slightly increased meteor activity from the CAMS video network, where the highest sporadic background activity for the entire month was from February 19–25. However, listening to the radio echoes showed some peak activity of the total number of signals in the middle of the month. The mismatch in the timing of peak activity can be explained by the fact that by listening to the radio fainter meteor signals can be recorded compared to the automatic observations. Theoretically, the data from CAMS video network and my automatic radio observations should agree with each other because they record phenomena with similar physical parameters (mass). Practical observations confirm this.
Acknowledgment
I would like to thank Sergey Dubrovsky for the software he developed for data analysis and processing of radio observations (software Rameda). I thank Carol from Poland for the Metan software. Thanks to Paul Roggemans for his help in the lay-out and the correction of this article.
References
Rendtel Jurgen (2021). “Meteor Shower Calendar”. IMO.
Jenniskens P., Gural P. S., Dynneson L., Grigsby B. J., Newman K. E., Borden M., Koop M., Holman D. (2011). “CAMS: Cameras for Allsky Meteor Surveillance to establish minor meteor showers”. Icarus, 216, 40–61.