An overview of the radio observations during March 2020 is given.
The graphs show both the daily totals (Figure 1) and the hourly numbers (Figure 2) of “all” reflections counted automatically, and of manually counted “overdense” reflections, overdense reflections longer than 10 seconds and longer than 1 minute, as observed here at Kampenhout (BE) on the frequency of our VVS-beacon (49.99 MHz) during the month of March 2020.
The hourly numbers, for echoes shorter than 1 minute, are weighted averages derived from:
N(h) = n(h-1)/4 + n(h)/2 + n(h+1)/4
During this month there were quite some local disturbances, but no registered “sporadic E” (Es) nor light activity. As expected, general activity was low, without eye-catching showers, but with nonetheless several interesting minor showers as shown by the graphs of overdense reflections.
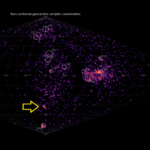
Attached are also a few examples of the strongest reflections (Figures 3, 4, 5, 6 and 7).
If you are interested in the actual figures, please send me an e-mail: felix.verbelen at skynet.be.

Figure 1 – The daily totals of “all” reflections counted automatically, and of manually counted “overdense” reflections, overdense reflections longer than 10 seconds and longer than 1 minute, as observed here at Kampenhout (BE) on the frequency of our VVS-beacon (49.99 MHz) during March 2020.

Figure 2 – The hourly numbers of “all” reflections counted automatically, and of manually counted “overdense” reflections, overdense reflections longer than 10 seconds and longer than 1 minute, as observed here at Kampenhout (BE) on the frequency of our VVS-beacon (49.99 MHz) during March 2020.

Figure 3 – 2020 March 2 at 6h30m UT.

Figure 4 – 2020 March 3 at 4h45m UT.

Figure 5 – 2020 March 9 at 12h10m UT.

Figure 6 – 2020 March 10 at 7h25m UT.

Figure 7 – 2020 March 14 at 9h45m UT.