Abstract: I present a preliminary analysis of the NTA activity using visual data from 1989 to 2019. The aim of the study is to determine the peak activity intervals of the shower and the activity period of the shower. The data for this study were taken from the VMDB (IMO). Unfortunately, a substantial number of VMDB records turned out to be unreliable and had to be removed. The small numbers of meteors per hour are affected by statistical scatter, no precise time of maximum could be determined, but a flat plateau with best rates occurs in the interval 226°–232° solar longitude.
1 Introduction
A prerequisite for studying the activity of this shower was the mismatch between the maximum date in the IMO calendar (November 13) and the weekly newsletters published by Robert Lunsford (November 3). I decided to find out when the maximum activity of the shower actually appeared.
Here is the information from Robert Lunsford: “According to the listing for the NTA’s in the IAU Meteor Shower Center, the latest listing from CMOR (#6 Brown et al.) lists the maximum at solar longitude 219 which corresponds to November 2nd. This data was obtained between 2002 and 2008 and published in 2010. An earlier entry for the same source lists the maximum at SL 224.5 which corresponds to November 7th. Note that the earlier entry was based on 470 meteors verses 2281 for the more recent entry. A more recent study (2016) by Jenniskens lists the NTA maximum at SL 220 which corresponds to November 3rd. Although your graph displays a sharp peak on November 13th, the graph you provided by CMOR displays little change in activity from November 4th through the 16th. The range in dates for all listings in the IAU Meteor Shower Center for the NTA’s are SL 214.1 October 28th to SL 234.4 November 17th. These are all reputable sources so I feel that we can safely conclude that the NTA’s reach a plateau-like maximum during the first half of November and that any date within that range could possibly be the true maximum.”
Table 1 – The NTA#017 data from the working list of meteor showers of the IAU Meteor Data Center.
| λʘ (°) | αg | δg | N | Reference |
| 224 | 58.6 | +21.6 | 80 | Porubcan and Kornos, 2002 |
| 224 | 44 | +18.9 | 25 | Kresak and Porubcan, 1970 |
| 214.1 | 44.7 | +19.8 | 22 | Jopek et al., 2003 |
| 224.5 | 53.3 | +21 | 470 | Brown et al., 2008 |
| 234.4 | 62 | +24 | 475 | SonotaCo, 2009 |
| 219 | 48.9 | +17.7 | 2281 | Brown et al., 2010 |
| 220 | 48.9 | +20.7 | 509 | Jenniskens et al., 2016 |
| 218.4 | 47.5 | +19.3 | 3173 | Jenniskens et al., 2018 |
2 Analyzing visual NTA data
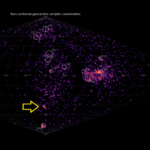
In a first attempt ZHRs were calculated for all the NTA data found in the Visual Meteor Database (VMDB) of IMO. The result was a rather chaotic plot which did not allow to reconstruct an activity profile (Figure 1). It was clear that the VMDB data needs a quality check before the data can be used.
After removal of the most obvious garbage a new, much smaller selection of observing data remains. However even after removal of a lot of junk entries, the ZHR-values displayed still a huge scatter at low ZHR values (Figure 2).
Figure 3 shows a graph of the shower activity with the ZHR averaged in function of the Solar Longitude. The main shower activity maximum occurs in the Solar Longitude range from 226° to 231° with ZHR values of 4±1. A possible second maximum can be seen at about Solar Longitude 251° with a ZHR of about 5. At the Solar Longitude 214°–217° appears a slight increase in activity level to a ZHR = 4. At the beginning of the shower activity at Solar Longitudes 197° the ZHR is very low with about 2. The shower activity starts probably earlier than Solar Longitude 196°–197°. Also, the activity of the NTA meteor stream does not end at 255° Solar Longitude. The IMO visual meteor database (VMDB) does not contain enough data to clearly define the period of shower activity. The graph in Figure 3 shows a slight increase in shower activity at a Solar Longitude of about 241°–242° with a ZHR of 4. The activity profile of the meteor shower seems to indicate four concentrations. However, this activity profile does not really fit with the maxima obtained from previous studies (see Table 1).
The low ZHRs are based on small numbers of shower meteors which are to a large extend affected by statistical scatter. One or two meteors seen more or less make a big difference. Perhaps it makes no sense to try to make activity profiles when the numbers of shower meteors are too small?

Figure 1. All the ZHRs based on the unfiltered VMDB data.

Figure 2 – NTA activity 1989-2019 based on the VMDB data after removal of obvious junk data.

Figure 3 – The averaged ZHR values for the NTA data taken from the IMO data 1989-2019.
3 Conclusion
Great care must be taken when using visual data from the IMO VMDB since a substantial amount of the records contain unreliable data. Before using any data, some quality control is essential to remove the garbage. After removal of all junk data, a much smaller amount of data can be used to average the ZHRs.
Two more problems appear. First of all, after removal of the unreliable data, too few data are left and several time intervals without data appear. Furthermore, the small numbers are very sensitive to statistical fluctuations. The single station observations, either visual or video have a high risk to include sporadic meteors that ‘seem’ to line up with the NTA radiant area. Such contamination of the low number of NTA meteors with sporadic chance-lined-up meteors make the hourly rate counts very uncertain.
The activity of the shower is low and prolonged in time (more than a month), no pronounced peak can be defined. The peak activity varies from year to year. Sometimes two or even three similar peaks of activity are observed during the shower activity period. Unfortunately, the data of IMO has gaps during which no observational data is available, the behavior of the shower during such interval is unknown. The date of the main shower maximum can be the interval in solar longitude 226°–232°.
All in all, seen the poor reliability of the VMDB data, the statistical fluctuations on small number hourly rates and the risk for contamination of these small numbers with sporadics, it may be recommended to study this shower rather based on orbit data.
Acknowledgment
I thank Robert Lunsford for his feedback and Paul Roggemans for the help to edit this article.
References
Brown, P.; Weryk, R. J.; Wong, D. K.; Jones, J. (2008). “A meteoroid stream survey using the Canadian Meteor Orbit Radar. I. Methodology and radiant catalogue”. Icarus, 195, 317–339.
Brown, P.; Wong, D. K.; Weryk, R. J.; Wiegert, P. (2010). “A meteoroid stream survey using the Canadian Meteor Orbit Radar. II: Identification of minor showers using a 3D wavelet transform”. Icarus, 207, 66–81.
Jenniskens P., Nénon Q., Albers J., Gural P. S., Haberman B., Holman D., Morales R., Grigsby B. J., Samuels D. and Johannink C. (2016). “The established meteor showers as observed by CAMS”. Icarus, 266, 331–354.
Jenniskens P., Baggaley J., Crumpton I., Aldous P., Pokorny P., Janches D., Gural P. S., Samuels D., Albers J., Howell A., Johannink C., Breukers M., Odeh M., Moskovitz N., Collison J. and Ganjuag S. (2018). “A survey of southern hemisphere meteor showers”. Planetary Space Science, 154, 21–29.
Jopek, T. J.; Valsecchi, G. B.; Froeschlé, Cl. (2003). “Meteor stream identification: a new approach – III. The limitations of statistics”. Monthly Notice of the Royal Astronomical Society, 344, 665–672.
Kresák, L’.; Porubčan, V. (1970) “The dispersion of meteors in meteor streams. I. The size of the radiant areas”. Bulletin of the Astronomical Institute of Czechoslovakia, 21, 153–169.
Porubčan, V.; Kornoš, L. (2002). “The Taurid meteor shower”. Proceedings of Asteroids, Comets, Meteors – ACM 2002. International Conference, 29 July – 2 August 2002, Berlin, Germany. Ed. Barbara Warmbein. ESA SP-500. Noordwijk, Netherlands: ESA Publications Division, ISBN 92-9092-810-7, 2002, pages 177–180.
Rendtel Jurgen (2019). “Meteor Shower Calendar”. IMO.
SonotaCo (2009). “A meteor shower catalog based on video observations in 2007-2008”. WGN, Journal of the International Meteor Organization, 37, 55–62.