An overview of the radio observations during May 2018 is given.
The graphs show both the daily totals (Figure 1) and the hourly numbers (Figure 2) of “all” reflections counted automatically, and of manually counted “overdense” reflections, overdense reflections longer than 10 seconds and longer than 1 minute, as observed here at Kampenhout (BE) on the frequency of our VVS-beacon (49.99 MHz) during May 2018.
The automatic counts were sometimes difficult due to (local) interference and of thunderstorm (10 days with sometimes strong lightning activity), but most of the counting errors were corrected manually.
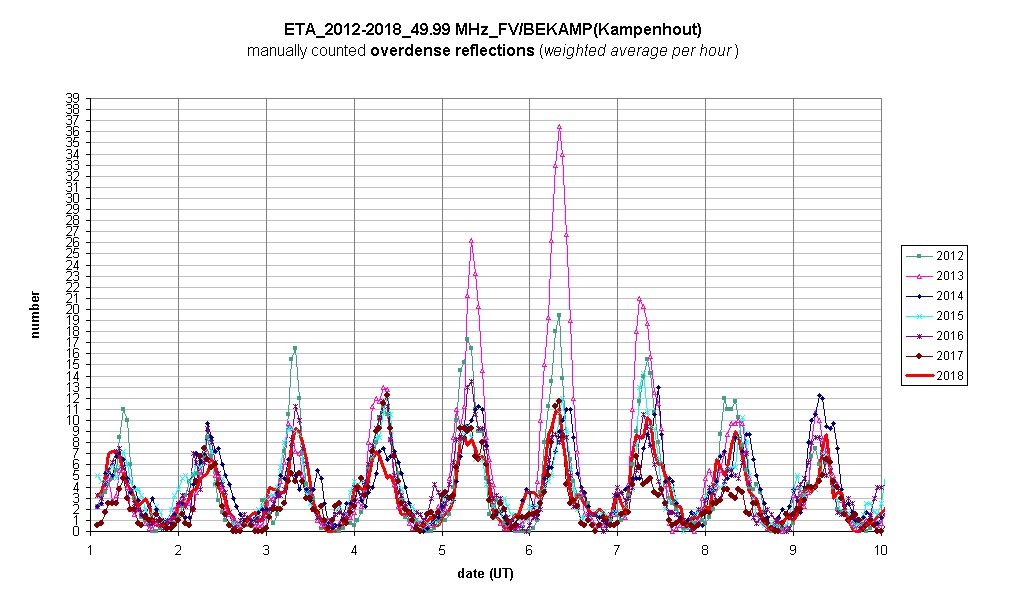
The eye-catchers of the month were the *eta-Aquariids* that showed a nice activity around 5 May, but were rather moderate overall, certainly in comparison with the activity in 2012-2013. – See attached graph with the hourly totals of all “overdense” reflections around the eta-Aquarids’ maximum activity of the period 2012-2018 (weighted averages) (Figure 3).
The hourly numbers, for echoes shorter than 1 minute, are weighted averages derived from:
N(h) = n(h-1)/4 + n(h)/2 + n(h+1)/4
If you are interested in the actual figures, please send me an e-mail: felix.verbelen at skynet.be
Figure 1 – The daily totals of “all” reflections counted automatically, and of manually counted “overdense” reflections, overdense reflections longer than 10 seconds and longer than 1 minute, as observed here at Kampenhout (BE) on the frequency of our VVS-beacon (49.99 MHz) during May 2018.
Figure 2 – The hourly numbers of “all” reflections counted automatically, and of manually counted “overdense” reflections, overdense reflections longer than 10 seconds and longer than 1 minute, as observed here at Kampenhout (BE) on the frequency of our VVS-beacon (49.99 MHz) during May 2018.
Figure 3 – The hourly totals of all “overdense” reflections around the eta-Aquariids’ maximum activity of the period 2012-2018 (weighted averages).

