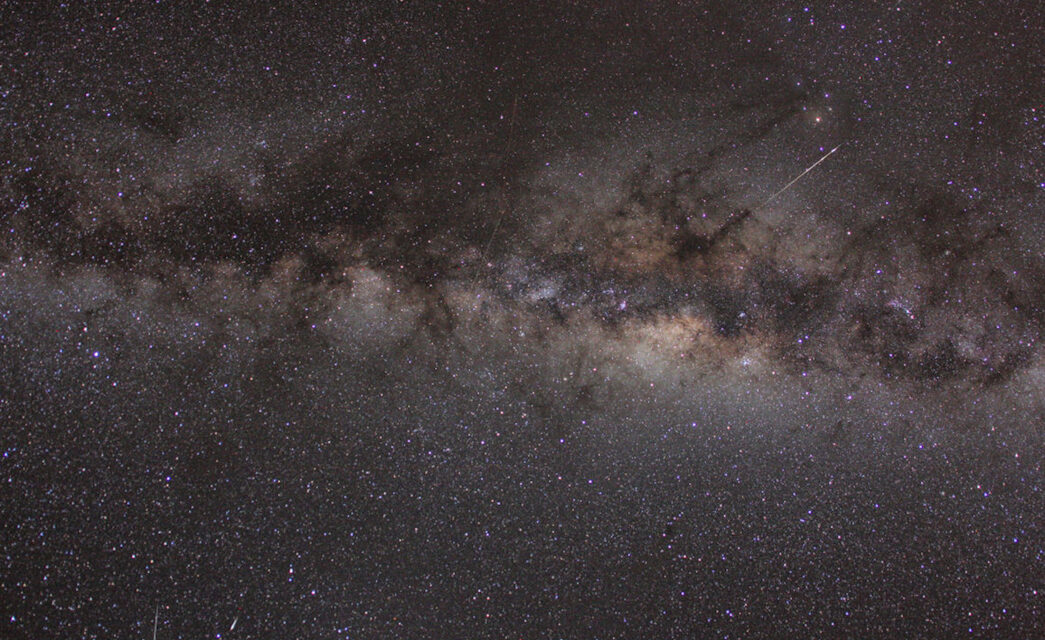
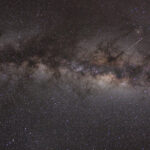
Composite image of the Milky Way taken at the Hakos Observatory in Namibia by the author in July 2011. The photo was taken with a Canon 40D, a Canon EF 15 mm F 2.8 lens mounted on an AstroTrac tracking mount. Three Capricornids and two Southern delta Aquariids can be seen.
Introduction
Besides the well-known Perseid maximum around August 12th, late July is also a good time to observe meteors. Besides the existing Perseid activity, many minor meteor showers are active: the Capricornids, the Aquariids complex, the gamma Draconids, and the Pisces Austrinids. Sporadic activity also increases significantly throughout July. All of this combined often results in high meteor activity. Most of the activity at the end of July comes from the Southern delta Aquariids (SDA). The SDAs are medium-speed meteors that are usually faint, although an occasional fireball is possible. DMS observers have often undertaken visual expeditions to better understand the meteor shower. The first good DMS data came from the first international expedition in 1984 in Puimichel, southern France. But especially the later expeditions to La Palma in 2008 [1, 2, 3] and Namibia in 2011 [4, 5, 6] yielded a wealth of visual data. Since those expeditions, the SDAs have been regularly observed from southern locations, resulting in analyses of the SDA’s based on IMO data. In 2025, the author conducted a study with two objectives: is there a trend in annual SDA activity and does the meteorshower sometimes show increased activity?
A bit of SDA history
The first possible SDA observations were made in August 1858–1883 by E. Heiss and G. Neumayer [7, 8]. It is possible that there is a mix-up here with the Antihelion radiant and the iota N/S and delta Aquariids N. In the following years, more observers reported meteors originating from roughly the radiant position of the SDAs. One of these observers was the well-known meteor observer William Denning.
It wasn’t until the 1950s that the SDAs were officially recognized as a meteor shower. Radar data (McKinley) provided some more information about the radiant and heliocentric velocity, and the photographic Harvard Meteor Project 1952–1954 (2000 meteors for which orbital elements could be calculated) showed a clear radiant drift and the discovery of the northern branch linked to the SDA. This was due to perturbations from the planet Jupiter. B.A. Lindblad concluded from the Harvard Meteor Project that the SDAs are active between July 21 and August 8 [9], while the northern branch is active between August 5 and 25. Meanwhile, we know from CAMS data, among other sources, that the SDAs are already active from July 15 to August 30, with a maximum on July 29 (λꙨ=126.5). The parent body may be comet 96P Machholz [12].
Analysis Method
When analyzing the observational data from different years, it became apparent that there are sometimes large differences in the ZHR values found between observers active in Northern or Southern Europe. The problem may lie in the radiant height of the shower and/or the transparency and brightness of the sky.
Table 1 shows the maximum radiant height on July 29th at a specific location. It also indicates how long the radiant remains above the 25-degree limit. The 25-degree limit is the minimum radiant height used by the author for ZHR analyses. For this reason, the author decided to limit the geographical limit to use only observations taken further south than 46° N.
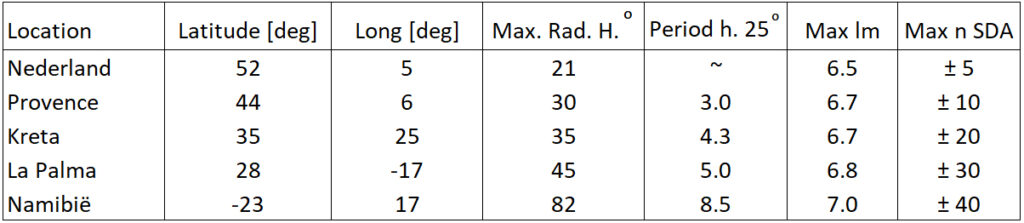
Table 1: Overview of several SDA observation locations. Column 5 shows the number of hours the SDA radiant is above 25 degrees height.
Column 7 shows the maximum number of observable SDAs. Of course, the latter column also depends on the Cp of an observer.
Next, the IMO database was consulted for SDA data from the period 2000-2025. Table 2 was compiled from this data.
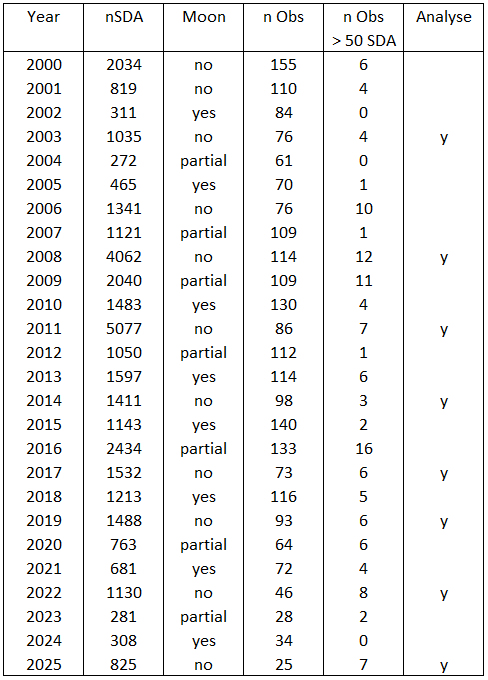
Table 2. Overview of available SDA data in the IMO database.
To determine which years can be used and which cannot, we looked at moonlight during the maximum period; years with abundant or partial moonlight were excluded. I also looked at how many observers observed more than 50 SDAs per year. These are observers who observed more than two nights, for which a good Cp is often available (Cp = perception coefficient). This information also provides additional insight into the choice of a particular year. Using only the number of observed SDAs as a benchmark is not an option here, because if we look at 2016, for example, we see that 2434 SDAs were observed. There were 133 active observers, but there was abundant moonlight during the SDA maximum. Most SDAs that year were seen after July 29th. Perhaps also because there had been considerable writing about the possible increased Perseid activity on the night of August 11/12, 2016, which resulted in many observers also seeing a considerable number of SDAs after their maximum.
Furthermore, the data were subject to the usual requirements:
- Minimum radiant height: 25 degrees
- Hourly counts are used except for the outbursts
- A reliable Cp for the observer must be known
- The individual observer must have observed a relatively large number of SDAs
- A weighted average ZHR was always determined over a day. In practice, this is usually between 20 and 11 UT (Europe and America). Australian data is sometimes also used.
- A fixed population index r of 2.7 was used.
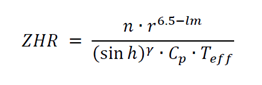
- The ZHR formula is:
To compare the graphs, the 2011 SDA ZHR graph was used as a basis, because a group of observers in Namibia collected a large amount of data with a large number of SDAs, high radiant positions, and excellent Bortle scale 1 observing conditions [5, 6]. There is, however, some difference compared to the earlier analysis of the 2011 data. At that time, the radiant height correction γ was set at 1.4, while it is now 1.0. Therefore, all years were recalculated with γ=1.0. The population index r was fixed at 2.70. This results in slightly lower ZHRs in 2003, 2008, and 2011 than what was calculated then. Table 3 provides information about the years and data that were used in this analysis.
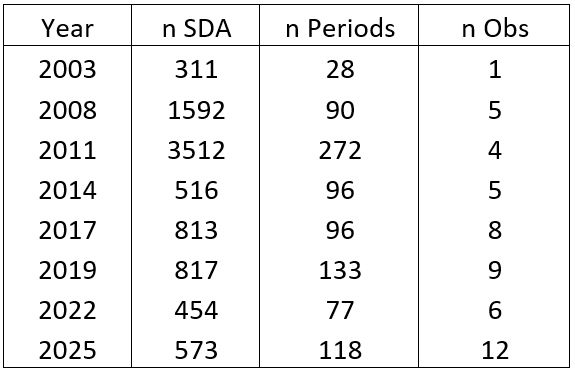
Table 3: overview of numbers of SDA’s, periods and observers used for this analysis.
The anual SDA comparisons
2003-2011
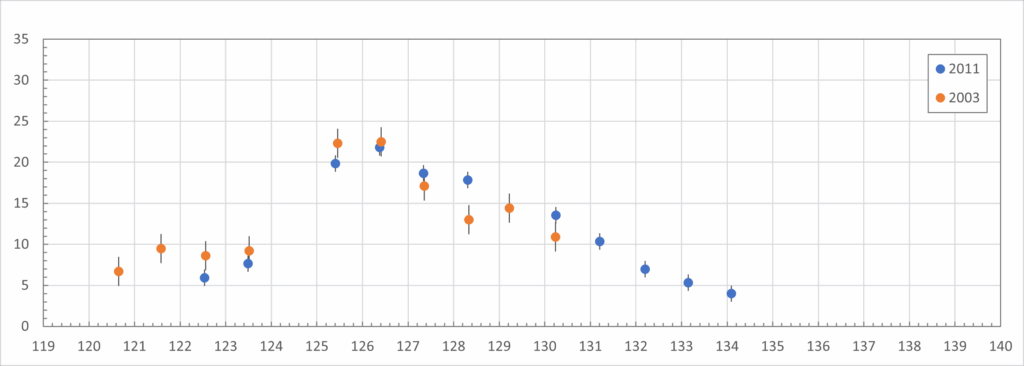
Figure 1. Comparison of the Southern delta Aquariids’ ZHR in 2003 and 2011.
Although the 2003 data is only a fraction of the 2011 data, the agreements are good. The possible outburst of July 28/29, 2003 (see next chapter), occurred near λꙨ=125.5. That ZHR point is indeed slightly elevated compared to 2011. But it is small, yet explainable. The ZHR before and after the observed increased activity was actually somewhat on the low side of what is expected for this period; see also Figure 7 in the next chapter. In other words, the increased activity is therefore barely reflected in the average ZHR for that night.
2008-2011
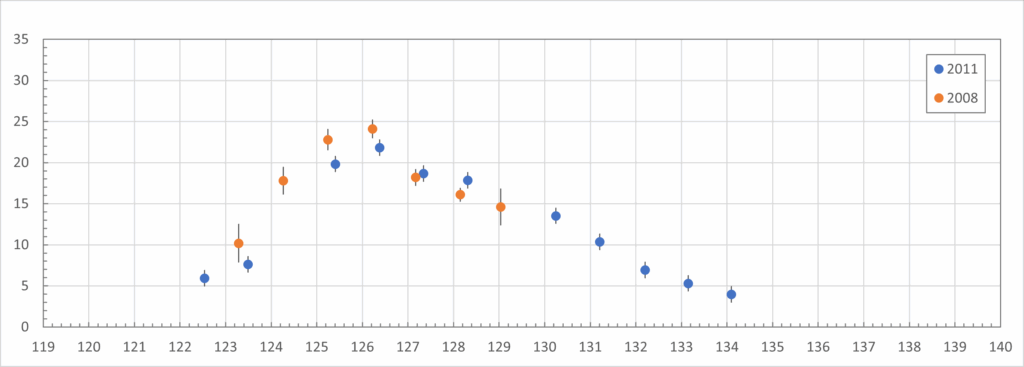
Figure 2. Comparison of ZHR Southern delta Aquariids 2008 and 2011.
As indicated in [5], both ZHR and population index r graphs were very similar. These are therefore the best SDA data sets from after 2000. In both ZHR graphs, a rapid increase of the ZHR towards the maximum and a slower decline after the maximum are visible.
2014-2011
Figure 3. Comparison of the ZHR Southern delta Aquariids 2014-2011.
A striking feature of this combination is that the upward trend is quite similar, but the downward trend is much lower than in 2011. Two possibilities: perhaps this is due to the very limited data available during this period (July 31st to August 2nd). Or it is simply a fact. Thomas Weiland observed from Crete in 2014 and obtained similar results as in 2011 [15].
2017-2011
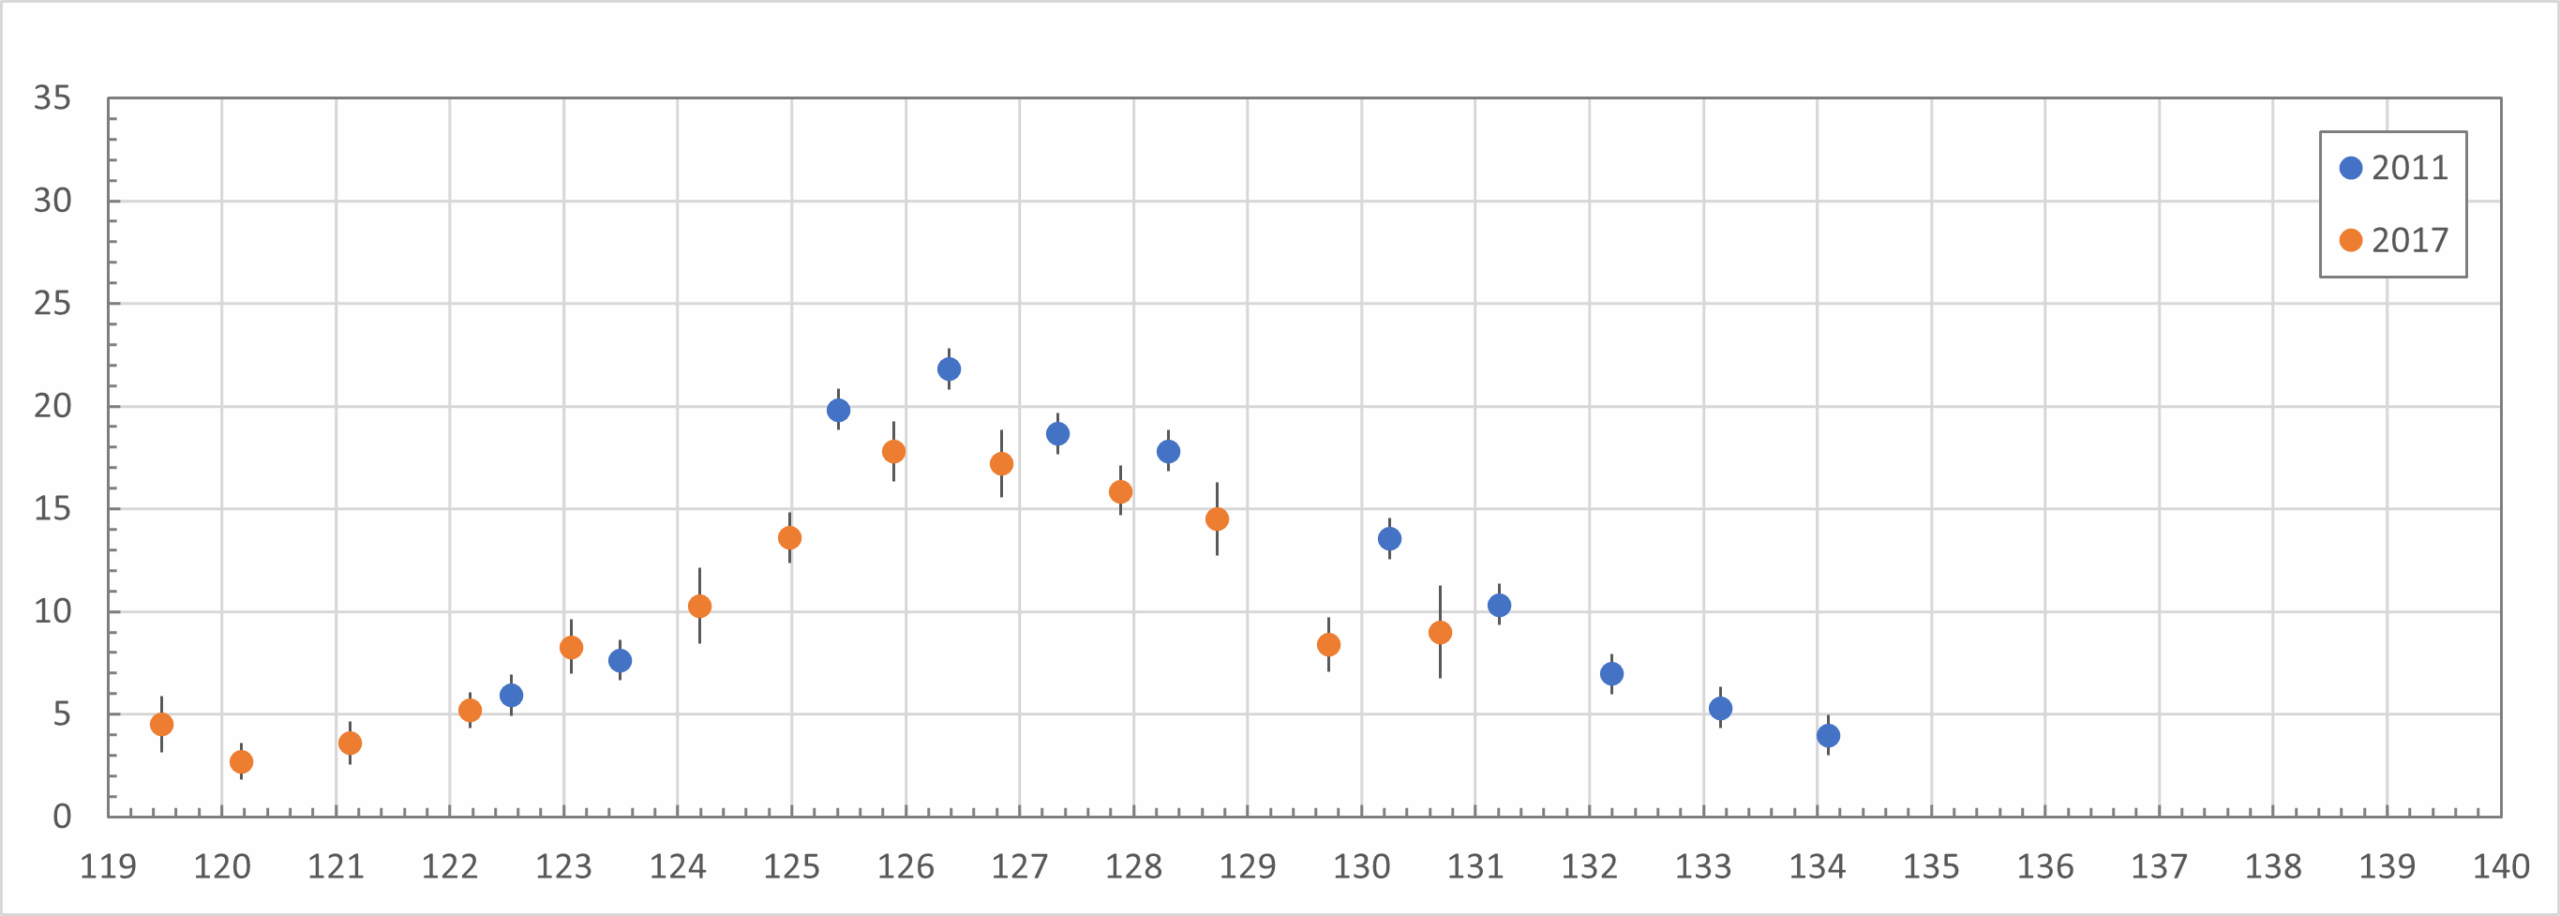
Figure 4. Comparison of the ZHR Southern delta Aquariids 2017-2011.
The entire 2017 graph follows the 2011 pattern fairly closely, but is slightly lower across the board.
2019-2011
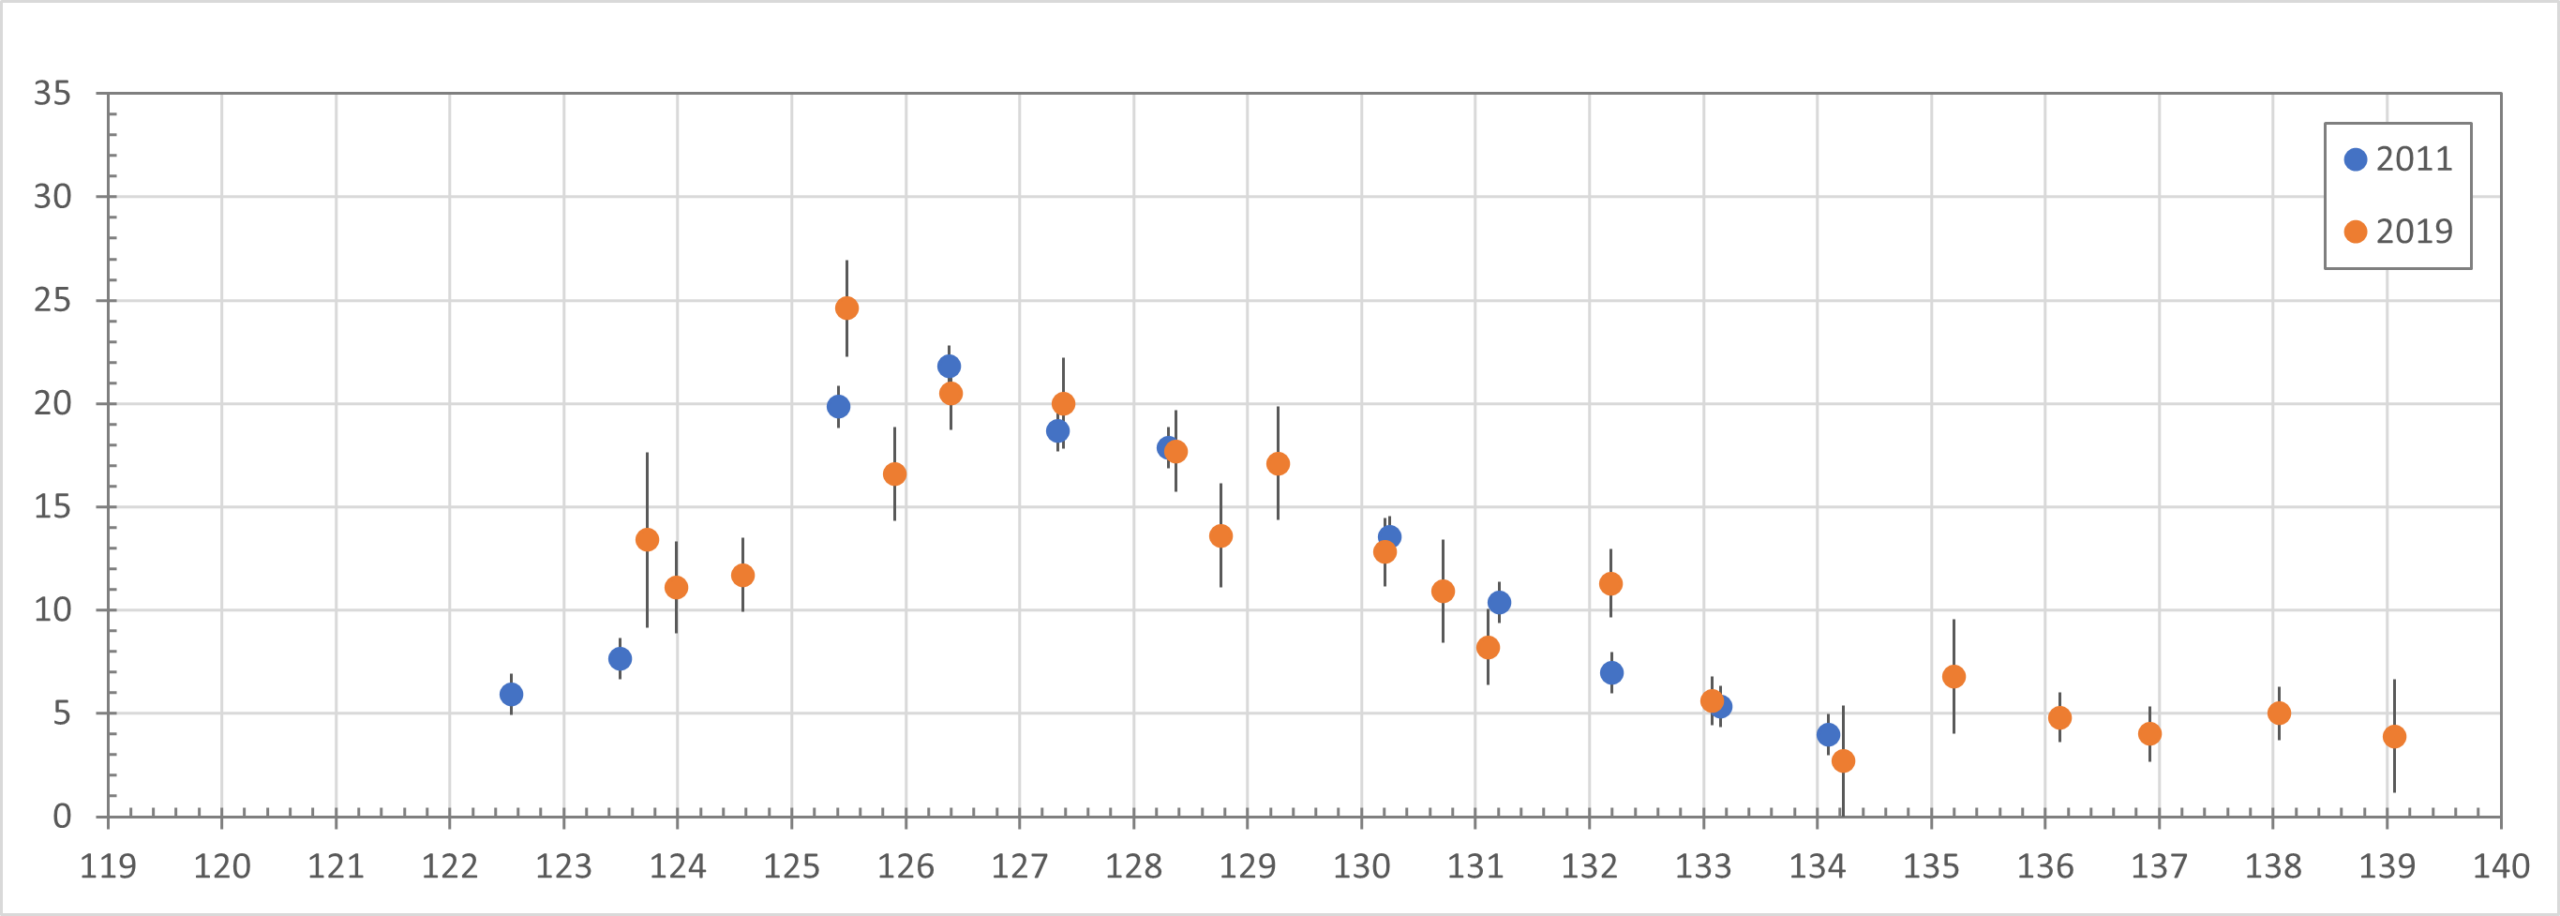
Figure 5. Comparison of the Southern delta Aquariids’ ZHR in 2019 and 2011.
The 2019 graph also follows the 2011 pattern nicely: sometimes slightly lower ZHR, sometimes slightly higher.
2022-2011
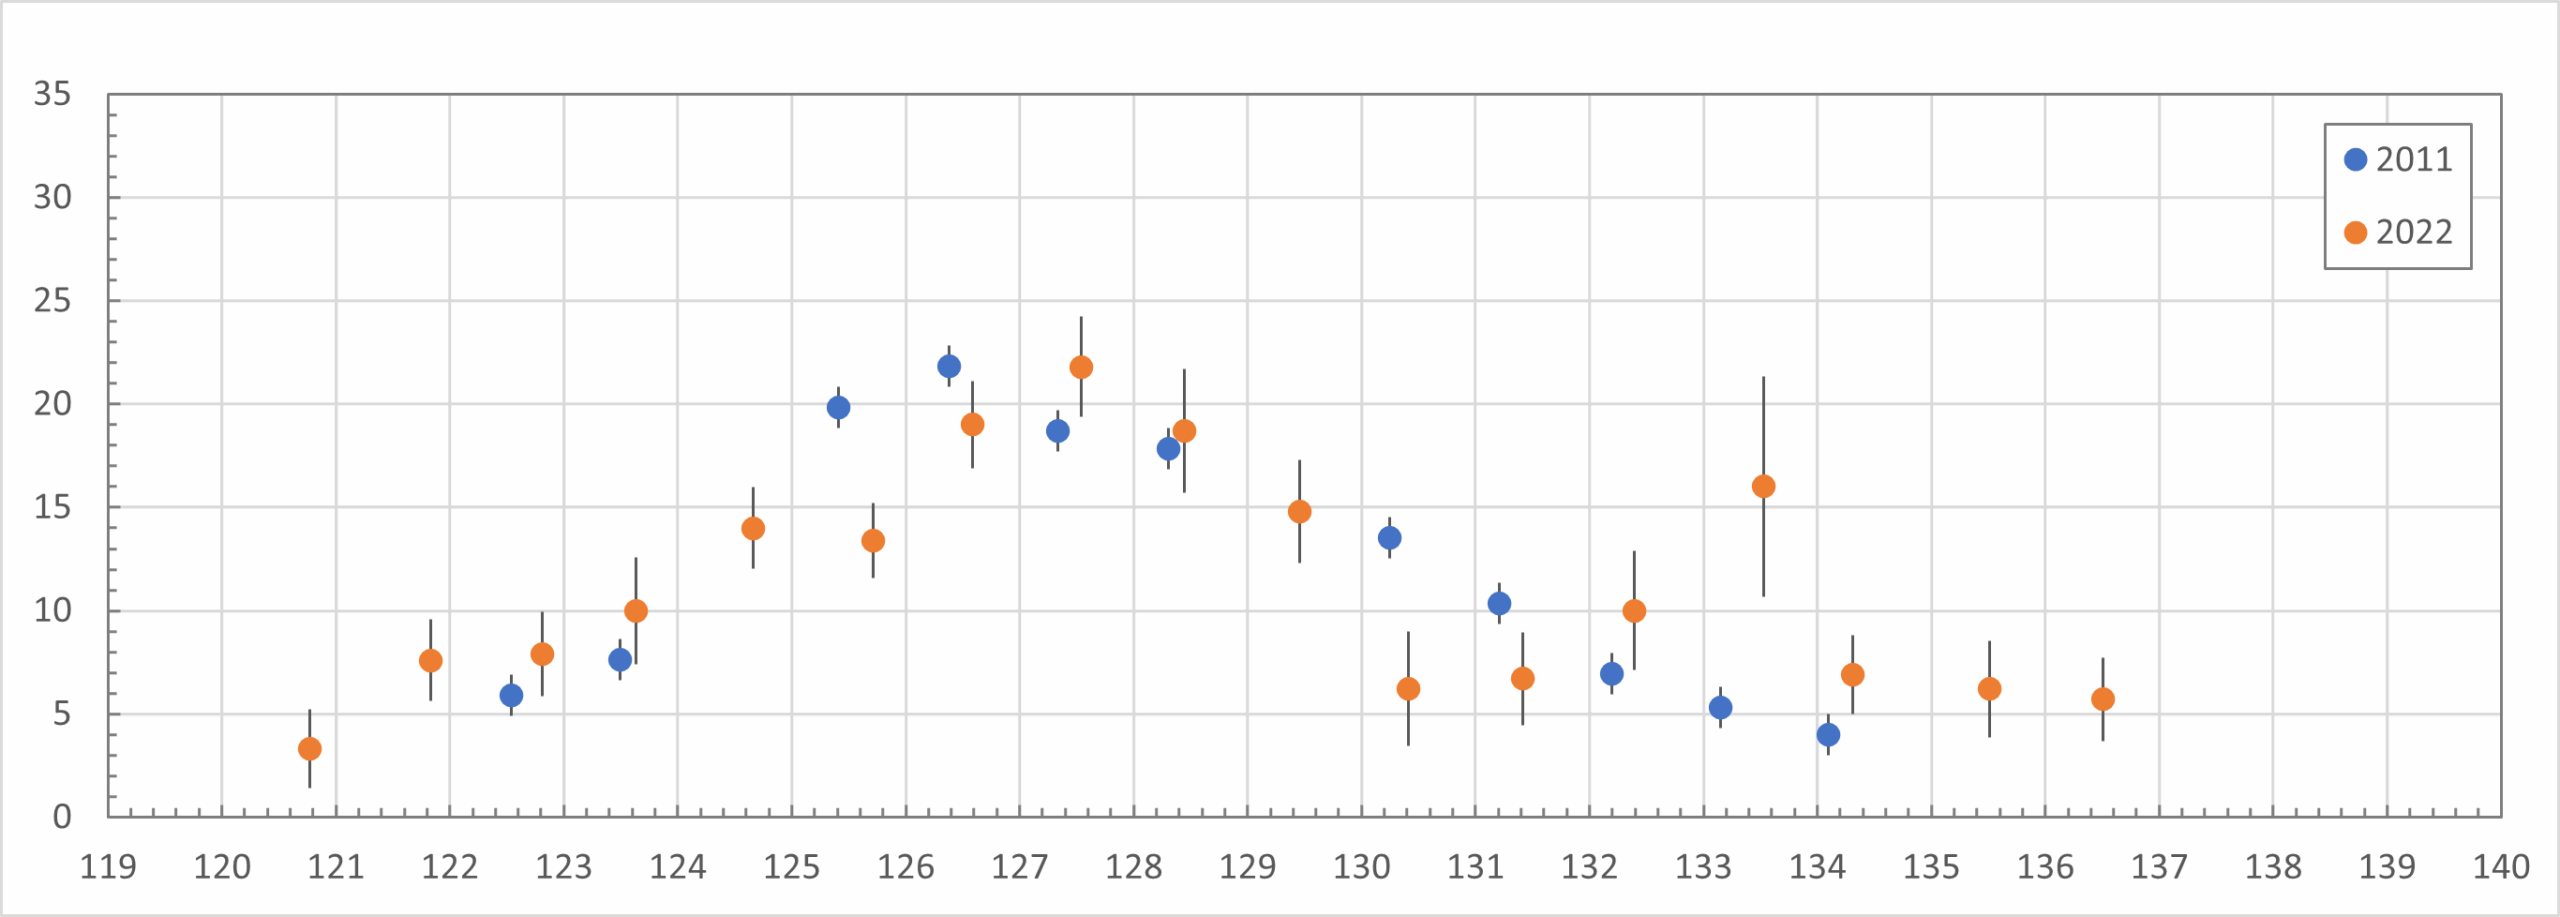
Figure 6. Comparison of the Southern delta Aquariids ZHR in 2022 and 2011.
The 2022 graph also shows a somewhat erratic pattern compared to 2011. A striking feature is the ZHR of 16 ±5 at λꙨ=133.5 (August 6, 2022, 7.4 UT). This data comes from an experienced observer, but with a relatively low radiant height. Comparing the graph with video data from the SDA’s GMN network in 2022 (see Figure 8 in the next chapter), there is no evidence of increased activity. Furthermore, it is notable that the maximum ZHR in 2022 (λꙨ=127.5) falls later than what I find in previous years. This ZHR point is most likely due to increased SDA activity. More on this in the next chapter.
2025-2011
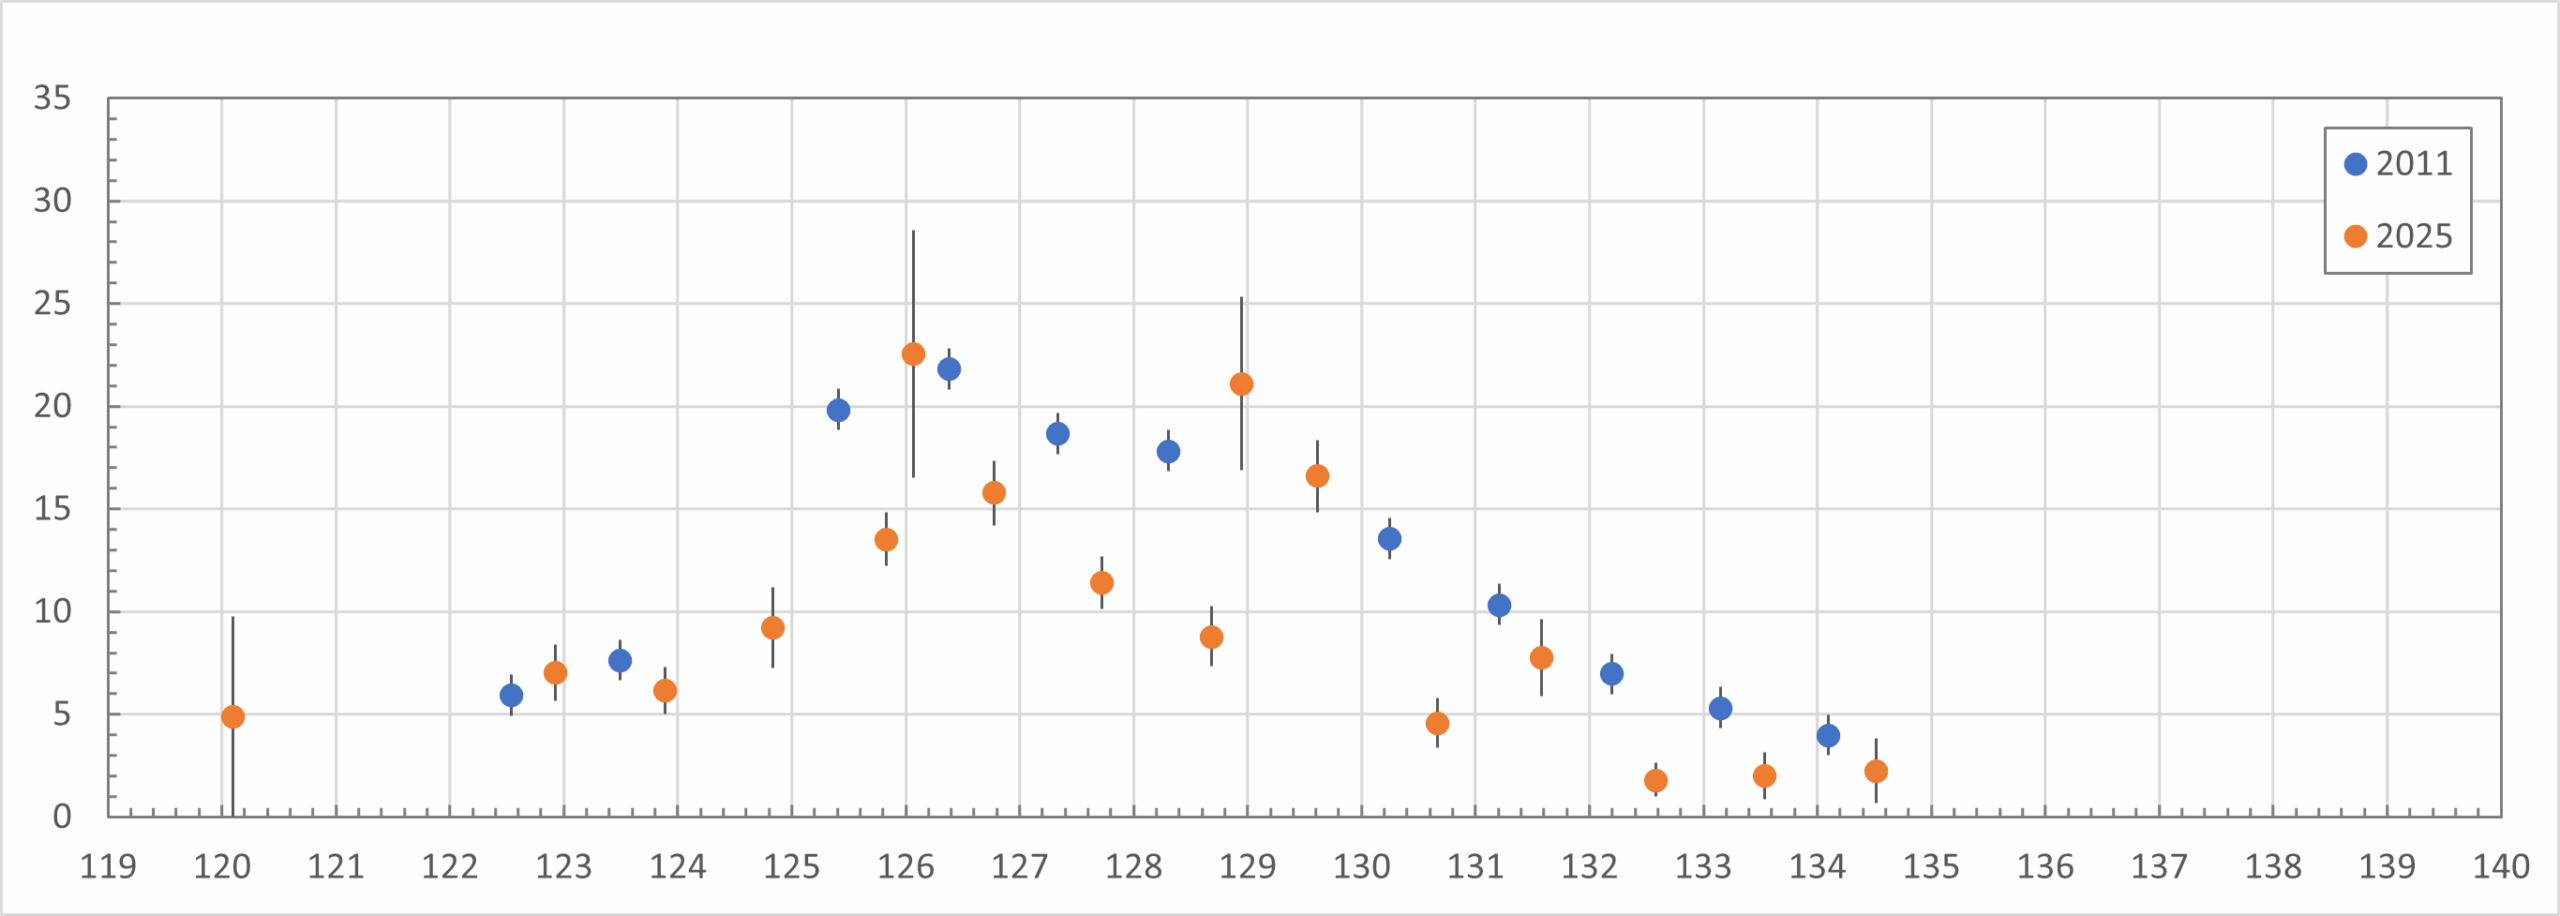
Figure 7. Comparison of the ZHR Southern delta Aquariids 2025 and 2011.
Two things stand out when comparing 2025 with 2011. Almost the entire 2025 graph is 30 to 40% lower in activity than 2011. Before this analysis began, Thomas Weiland, observing from Crete, reported seeing roughly 30% fewer SDAs compared to previous observations from that location. What is higher than the 2011 graph are the two points at λꙨ = 129.0 and 129.6. These may also indicate increased SDA activity. This will be discussed in the next chapter.
Discussion of SDA activity between 2000 and 2025
Generally, we can say that the activity remains relatively consistent annually. Looking closely at the ZHR in recent years, it is noted that the declining activity sometimes lags slightly behind compared to 2008-2011. This, combined with the much lower activity in 2025, could lead to the conclusion that we’re in a downward trend with the SDAs. However, there are nuances.
Clearly: 2025 is a less active SDA year. The other years are only slightly lower than 2011. The deviations sometimes overlap or are close together. The difference could also be caused by weak SDAs that are less noticeable in locations other than La Palma and Namibia (both Bortle 1 locations). This is because the skies in Namibia and La Palma are very transparent, even at much lower altitudes.
Using the correction for the radiant height γ=1.0 instead of 1.4 also produces lower ZHRs at lower radiant altitudes below 40 degrees. At 40 degrees, this is approximately 20 percent, and below that, it increases to 100% at 10 degrees. Above 40 degrees, the differences are small and within the error margins.
All of this is a good reason to go out and look for the SDAs again. It might also be useful to extend this research to the period before 2000 (IMO). The author still has a very small portion of the DMS visual paper archive, which contains numerous SDA observations from the Western Australian Meteor Section (WAMS) from 1977-1991. Unfortunately, only the SDA observations from 1977 are missing.
Possible SDA Outbursts
While searching for possible increased SDA activity, the on-the-fly curves on the IMO website were also examined. Occasionally, something “suspicious” was found this way, but often it wasn’t an outburst. An example is the 2014 On-The-Fly diagram. At solar longitude 127.703 (July 29, 2014, 04 UT), we see a ZHR of 37 ± 10. The accompanying table shows that this value is based on only 12 SDAs. Looking at the observation in question, it was made at an lm of 5.88 (just at the limit the author always sets for analysis) and a cloud cover factor of F=1.13. This, combined with a low radiant, can produce such high values.
Date: July 28/29, 1977
In the book Meteor Showers. An Annotated Catalogue Second Edition [8] written by Gary Kronk, on page 148, the following is written about the Southern Delta Aquariids: “Section director J. Wood said a maximum ZHR of about 42 was observed on July 29, 1977, with an overall observed duration from July 23 to August 14″.
Unfortunately, the data is no longer available via J. Wood or G. Kronk. Furthermore, the moon was nearly full on July 29, 1977. Observers observing under moonlight conditions often tend to underestimate the limiting magnitude, resulting in too high ZHR’s. On the other hand, Australia still has very dark and very dry locations, and the moon will have less of a negative influence on the limiting magnitude. To investigate whether overlap in solar longitude could be found during potentially increased activity in more recent years, the following research was conducted.
The (winter) night of July 28/29, 1977, in Western Australia lasted approximately from 11 to 22 UT. Table 4 shows the data for this night.
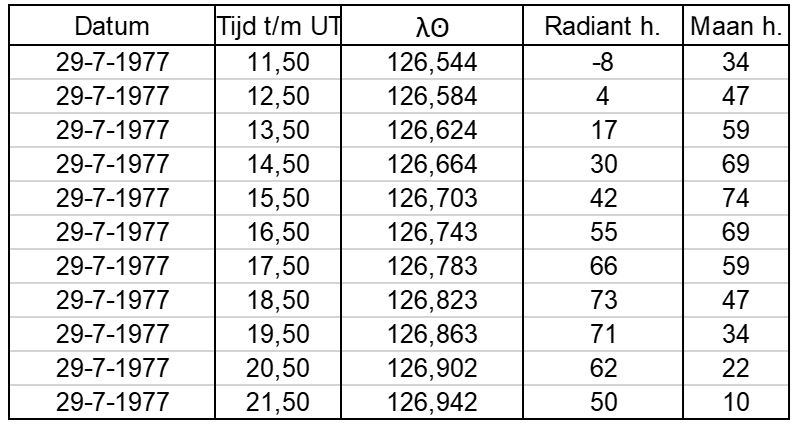
Table 4. Situation of the night of July 28/29, 1977, in Western Australia with a 95% illuminated moon.
Assuming that observers will primarily observe at high radiant altitudes, observations will not have occurred until after 14 UT, and perhaps even later due to the moon. Observations will have been in a northeasterly to southeasterly direction. After that time, the moon moved rapidly toward the western horizon. Based on these assumptions, the high ZHR of 42 would have been observed somewhere between λꙨ = 126.664 and 126.942. This is the period when the SDA radiant rises above 30 degrees and extends until dawn. It is further unknown whether the ZHR of 42 was the average ZHR or a peak value. Unfortunately, besides counts, there are no descriptions of the observed brightnesses of the shower.
July 28/29, 2003
In 2003 the author stayed at a small holiday park near Ferma, on the south coast of Crete, from July 20th to August 3rd [8]. Observations were possible there for 10 nights [11]. On the night of July 28th/29th, the sky was crystal clear and very transparent. After 23:30 UT, the SDA activity increased, shortly turning into a spectacular display. Many SDAs were observed in a short period. For example, between 23:40 and 00:52 UT, 36 SDAs were observed (see table 5). These are numbers only observed during a normal maximum in Namibia or La Palma. In 2011, observations were again possible from Namibia around the same solar longitude, but no increased activity was observed [5, 6].

Table 5. Data from the author from the night of July 28/29, 2003.
Several observers were active around the same time. Unfortunately, they didn’t observe enhanced activity like the author. The reasons for this are very low limiting magnitudes and/or too far northern geographic position. However, one observer, Roberto Haver, a well-known meteor observer from Italy, did meet the requirements. See:
https://www.imo.net/members/imo_vmdb/view?session_id=16221
Unfortunately, he didn’t observed the number of SDAs as seen by the author. There is no explanation for this discrepancy. His observational data shows that he plotted the meteors. This takes over fifteen minutes of his observation data per hour. Perhaps this affects the ZHR because the author observed sometimes within seconds more SDA’s. Unfortunately, there is no information from the observer in question about the observational direction or the sky’s transparency. The latter certainly affects the visibility of the usually faint SDAs. A ZHR calculation based on the author’s observations with an assumed population index r 2.7, Cp 1.2 and radiant height correction of 1 (instead of 1.4 from the old analysis) finds a maximum on 29 July 2003 at 00:36 UT with a ZHR 35 ± 10. See Figure 8 and Table 6 for further details.
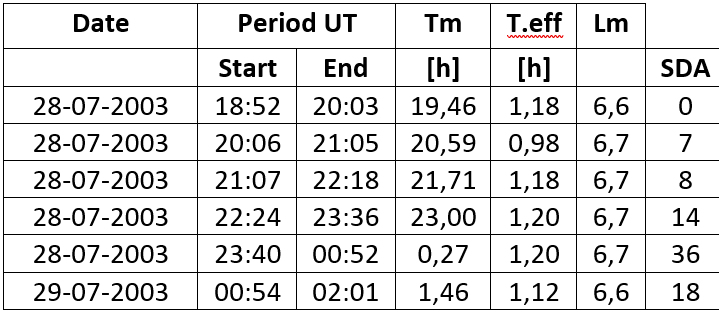
Table 6: ZHR of the Southern delta Aquariids during the night of 28/29 July 2003.
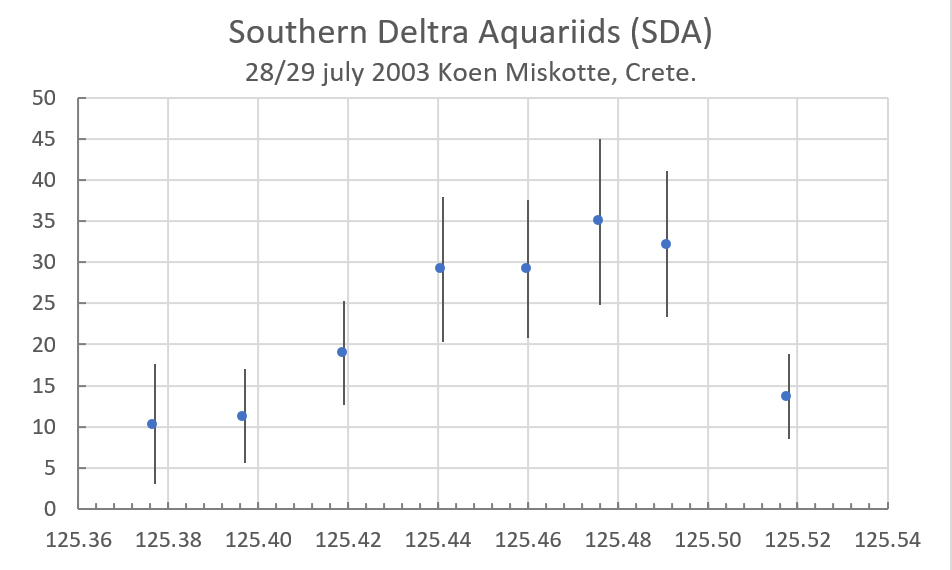
Figure 8. The ZHR graph of the SDAs during the night of July 28/29, 2003 by Koen Miskotte, Ferma, Crete.
July, 30, 2022
While entering data from 2022, the author came across this remarkable observation by Terrence Ross, a prolific visual meteor observer from Texas, USA:
https://www.imo.net/members/imo_vmdb/view?session_id=84234
At first glance, nothing unusual seems to have happened, but looking at the actual time periods reveals unusual activity. The author contacted the observer, who was able to provide him with all basic data with shorter counting periods. The ZHR calculations were based on half-hourly counts taken every fifteen minutes. The r value was chosen as 2.7 based on the totals in Table 7. This resulted in Table 7 and Figure 9.
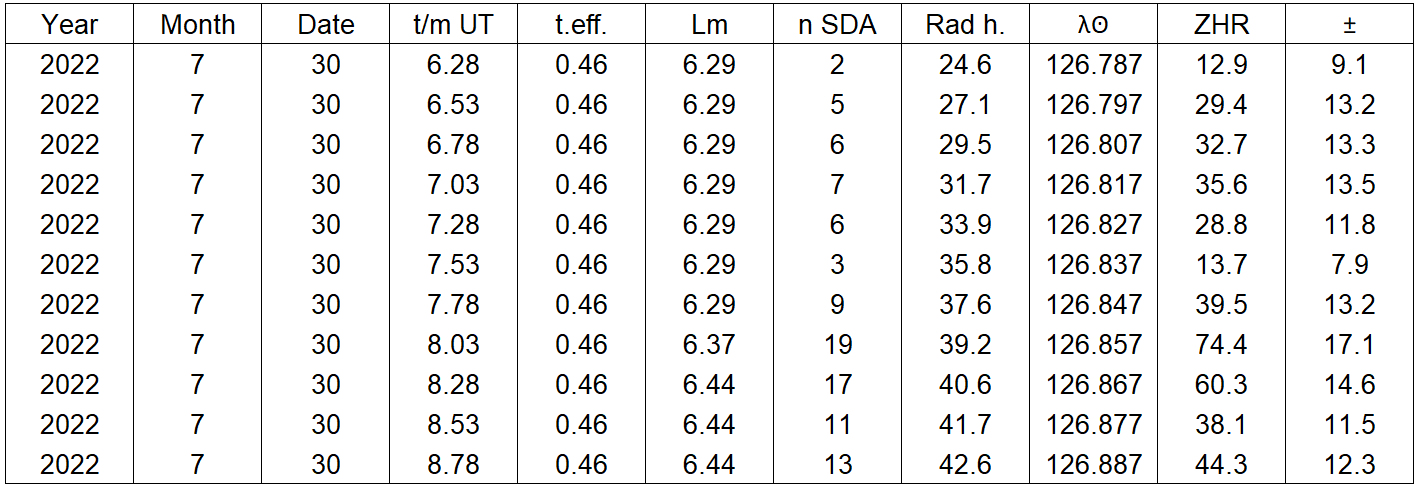
Table 7. The ZHR of the SDAs on July 29, 2022 as observed by Terrence Ross, Texas, US.
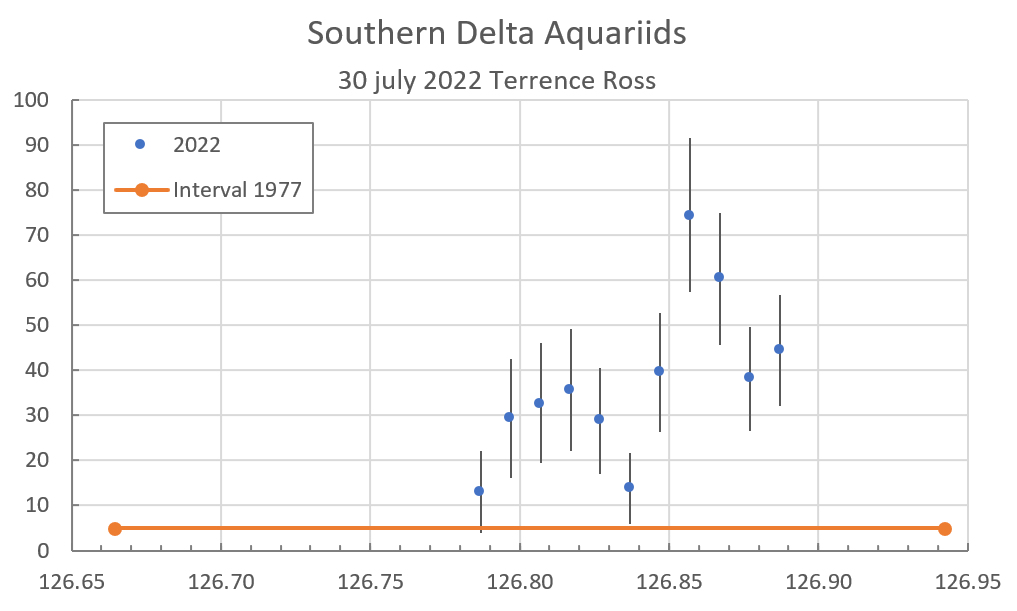
Figure 9. The ZHR of the SDAs as observed by Terrence Ross on July 29, 2022.
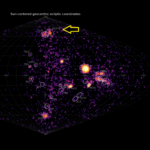
This very interesting observation can be interpreted as a broad 2.5-hour enhanced activity with a dip in the middle, or two outbursts in a row. The calculated maximum ZHR of 75 ± 17 is very high by SDA standards. The magnitude distribution is also striking; see Table 8. Unfortunately, no other observers were active during the observation to confirm this high SDA activity.
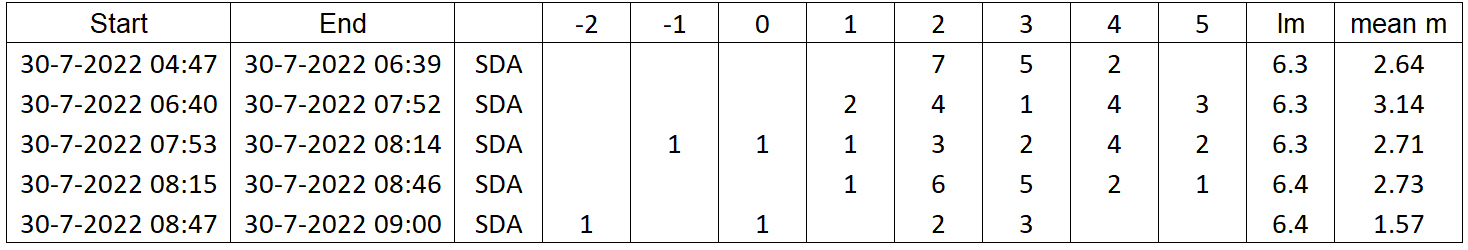
Table 8. Magnitude distribution of SDAs on July 29, 2022, as observed by Terrence Ross.
For the entire series of magnitude distributions, r[-2;5] was 2.60 ±0.28 and r[-1;5] was 2.88 ±0.29.
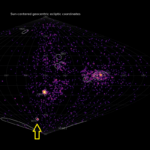
The numbers per interval are too small to calculate a population index r, but the table already shows that the number of bright meteors increased during the outburst, while the number of faint meteors decreased. This is also reflected somewhat in the average magnitude. Since this is a recent observation, the author was able to search for confirmation via the GMN network. Figure 10 is the graph from the GMN website, compiled from simultaneously recorded SDAs.
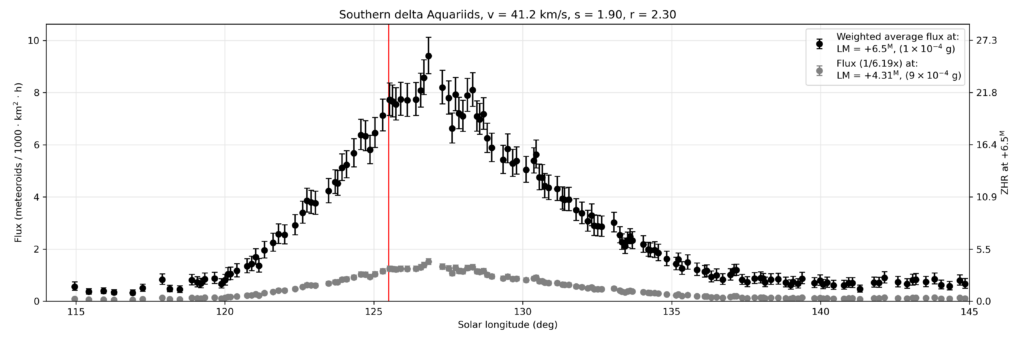
Figure 10. ZHR/flux curve of the GMN network of the SDAs from 2022 [13, 14, 16].
A striking feature is an extra peak above the broad peak at solar longitude 127. This coincides exactly with the peak of the visual curve. You can’t directly compare the graphs, of course, because the underlying data is completely different. However, the fact that both observation techniques find a peak in activity at the same time is striking. This confirms the visual peak. Also interesting is the fact that this high activity occurred in the same time window as on July 29, 1977, in Australia (see the red horizontal line in Figure 9).
August 1/2, 2025
Another interesting observation last year: a late, possible outburst on the night of August 1/2, 2025. The possible outburst was observed from Israel by observers Anna Levin, Eini Shlomi, and Ella Ratz. They were at exactly the same location and all looked in the same direction. The results from these three observers are summarized in Figure 11. This was done using 20-minute counts, with the ZHR calculated every ten minutes using an assumed population index r of 2.70. An average ZHR was then calculated for all individual ZHRs.
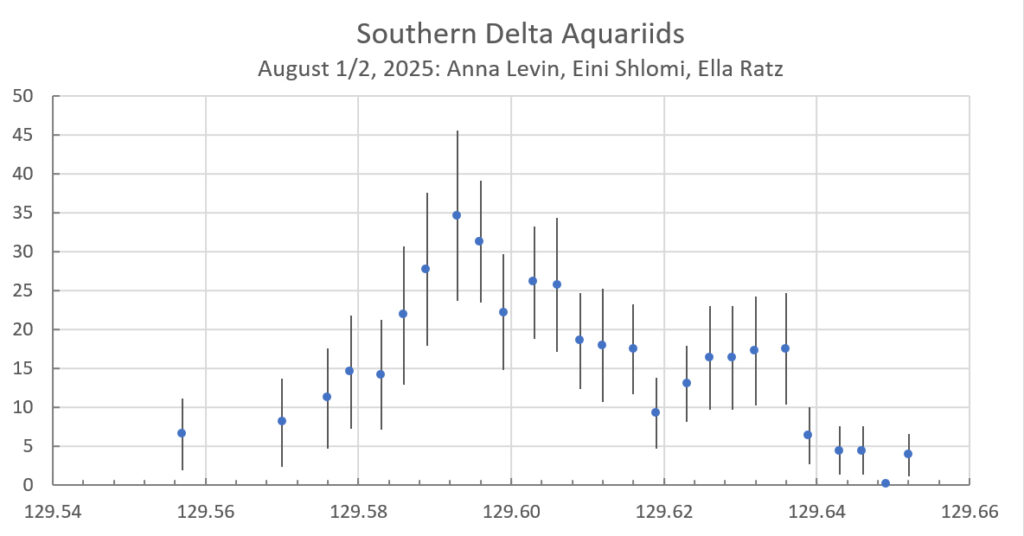
Figure 11. ZHR profile of the SDAs during the night of August 15, 2025 based only on Israelian observations.
With a maximum ZHR of 35 ± 11 at 23:10 UT (λꙨ=129.593), there was considerable activity. However, there was a problem. At the same time, another observer was active: Thomas Weiland, observing from Crete, Greece. His observation was not yet available on the IMO website when the first ZHR curve was generated. At the time the Israeli observers saw the outburst, Weiland observed relatively normal activity. However, right at the end of his session, he saw the ZHR surge to 20. Unfortunately, the Israeli observers had stopped by then.
Weiland’s data were added, resulting in figure 12. Instead of using overlapping data as in Figure 11, the average ZHR was determined every fifteen minutes. Interestingly, two peaks are now visible, with a ZHR 13 near λ=129.60 and a ZHR 20 near 129.68. This is slightly higher than what you would normally expect at this solar longitude.
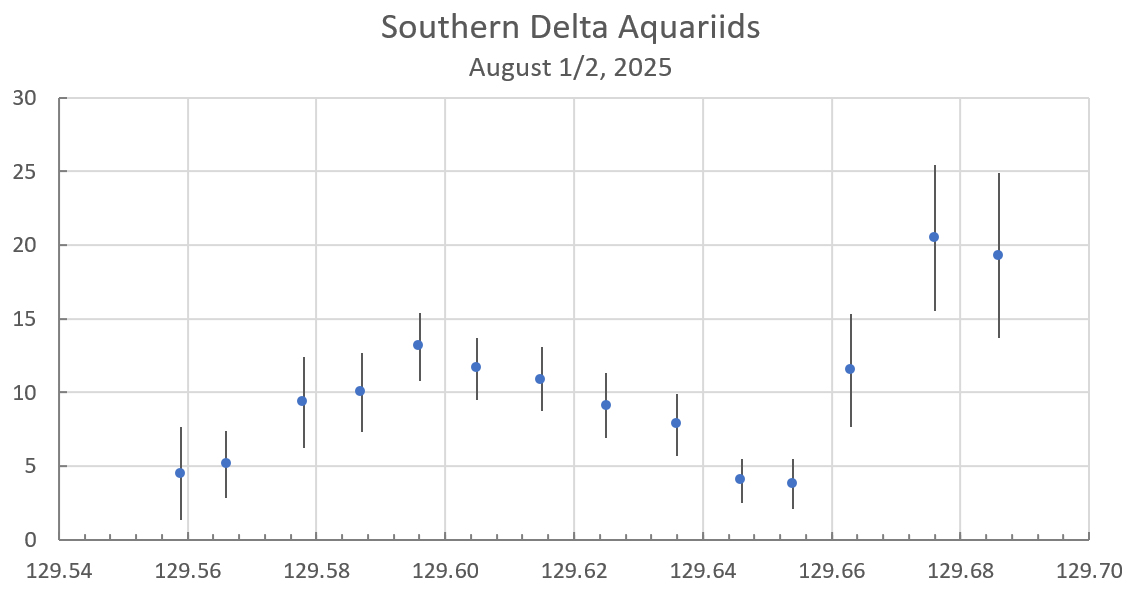
Figure 12. ZHR profile of the SDAs during the night of 1/2 August 2025, Anna Levin, Eini Shlomi, Ella Ratz and Thomas Weiland.
So the question is, is this increased SDA activity? Comparison with the video ZHR curve from the GMN video network indicates a peak in activity around λ=129.5 during this night with a ZHR of 17. Again, these are two completely different observation techniques. But the fact that both techniques find a peak around the same time is interesting.
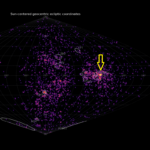
Another striking detail: if we look at the progression of the graphs in figures 12 (2025) and 14 (2022), they show a similarity: a weak peak followed by a dip and a higher peak. The width of both graphs also corresponds quite well, with about 0.11° in 2025 (starting from ZHR 10) and 0.12° (but possibly a bit longer) in 2022. The solar longitude at which both phenomena occurred is quite different. The author has no further explanation for this.
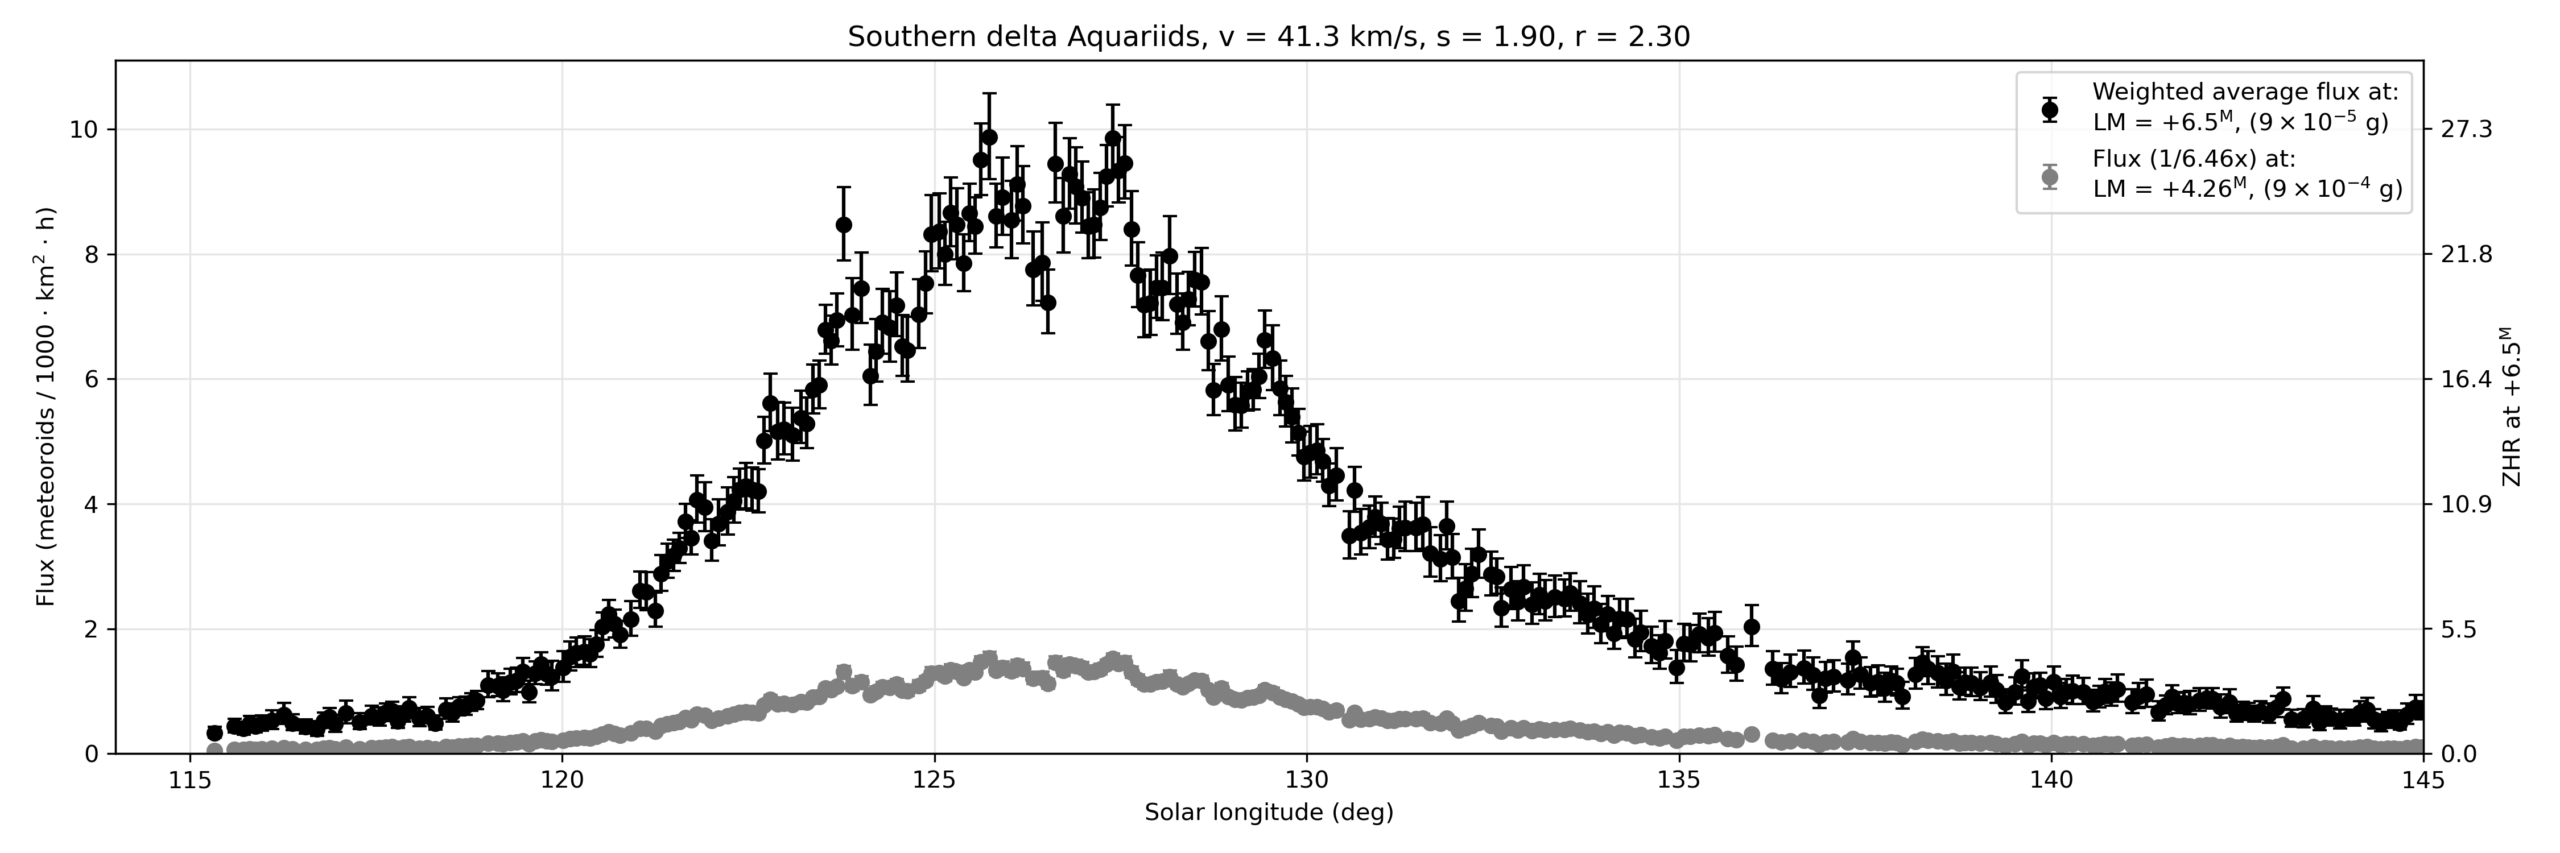
Figure 13. ZHR of the SDAs in 2025 based on GMN multistation video data [13, 14, 16]. Note the subpeak around solar longitude 129.0.
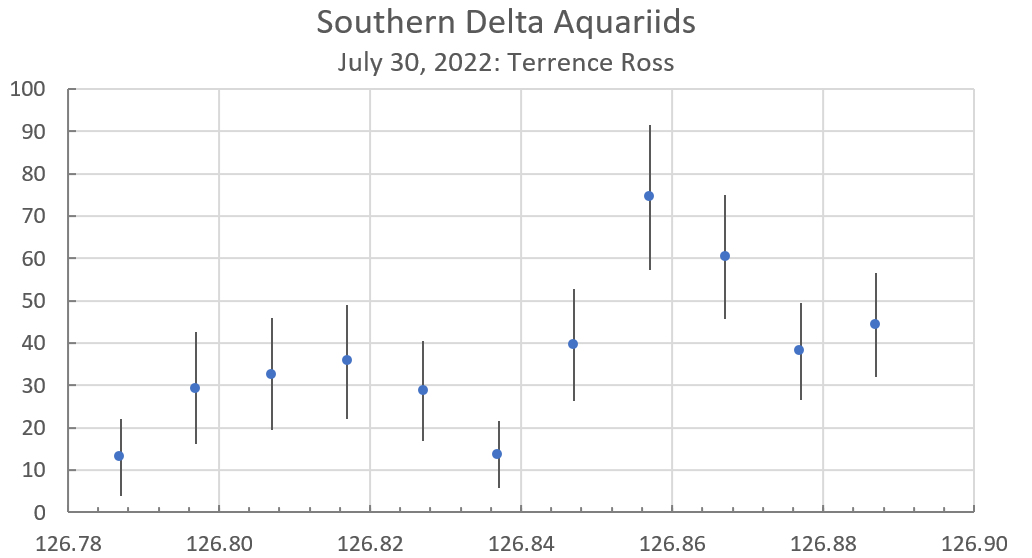
Figure 14. ZHR distribution for the night of 29 July 2022, as observed by Terrence Ross. Compare to Figuee 12.
Conclusions
The SDA meteor shower appears to remain stable over the period 2000-2022, but 2025 shows significantly lower activity. Looking at 2017, 2019, and 2022, there could have been also a slight downward trend, but this is more likely due to the differences in observational locations and the chosen correction for the radiant height. Furthermore, the SDAs appears to occasionally show increased activity (or strong subpeaks). The 2022 outburst stands out with high ZHR values. The 2003 outburst is unconfirmed, and 2025 could also have been a subpeak. A surprising similarity is that the peaks from 2022 and 2025 are actually double peaks. It is also clear that geographically southern locations provide a good indication of SDA activity. Observations made from more northern locations often show significant differences compared to observations made from southern locations.
Acknowledgments
I am sincerely greatful to all observers who have ever observed SDAs for their contributions. The list is too long to publish. However, I would like to acknowledge the observers who traveled specifically for this meteor shower or with whom I exchanged ideas about the results: Jürgen Rendtel, Anna Levin, Thomas Weiland, Kai Frode Gaarder, Terrence Ross, Peter van Leuteren, Klaas Jobse, Carl Johannink, Michel Vandeputte, Felix Bettonvil, Casper ter Kuile, and Pierre Martin.
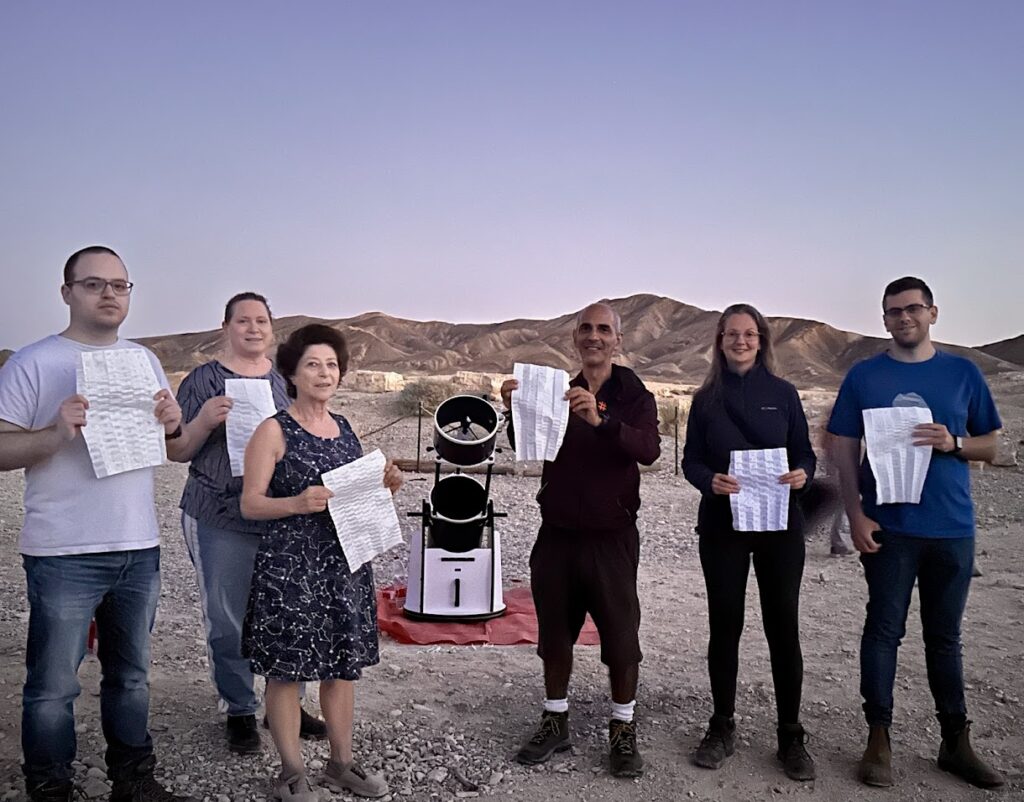
Figure 15: the Israelian meteor observers in 2025: from left to right Omri Katz, Noga Karni, Anna Levin, Shlomi Eini, Ella Ratz and Ido Braun. It is thanks to groups and individual observers that visual analyses with useful results can still be made. This article is therefore a tribute to the visual meteor observer. Visual meteor observations are the most demanding but also the most satisfying observation method. Watching meteors live under a brilliant clear sky is so much fun!
References
[1] P. van Leuteren, De Zuidelijke Delta Aquariiden vanuit La Palma, eRadiant 2008-1, p. 86-97.
[2] C. Johannink, K. Miskotte, K. Jobse, Resultaten van de Aquariiden-campagne op La Palma juli 2008, eRadiant 2008-4, p. 98-107
[3] C. Johannink, K. Miskotte, K. Jobse, M. Vandeputte, P. van Leuteren, Results of the Aquariid expedition to La Palma, July 2008, WGN 36:6 (2008), p. 139-147
[4] P. van Leuteren, Namibië, land van natuurlijke duisternis, eRadiant 2011,4, p. 87-98
[5] C. Johannink, K. Miskotte, Resultaten van de Aquariiden-campagne in Namibië juli 2011, p. 103-107.
[6] Johannink, Miskotte K., Results for the Aquariid-expedition to Namibia, July 2011, WGN 40-2 2012, p. 65-68.
[7] E. Heis, J.F.J. Schmidt, On Meteors in the Southern Hemisphere. Mannheim: J. Schneider (1867), p. 15
[8] G. Kronk, Meteor Showers. An Annotated Catalog Second edition (2014) Springer, p.142.
[9] B.A. Lindblad, Smitsonian Contriubutions to Astrophysics 12, 1971, p.16.
[10] K. Miskotte, Meteoren waarnemen vanaf Chios eiland, Radiant 23-4, p. 80-83
[11] K. Miskotte, (Meteoren) waarnemen op Kreta, Zenit juli/augustus 2004, p.375-376.
[12] P. Jenniskens, Atlas of Earth’s Meteor Showers, Elsevier, 2024 p. 71.
[13] https://globalmeteornetwork.org/flux/plots/
[14] https://globalmeteornetwork.org/
[15] T. Weiland, 2014 Southern δ-Aquariid observing campaign – carried out from Crete, Proceedings of the IMC, Egmond 2016, p. 338-340.
[16] D. Vida et al, Computing optical meteor flux using global meteor network data, Monthly Notices of the Royal Astronomical Society, Volume 515, Issue 2, September 2022, P. 2322–2339.
