The Quadrantids showed a relatively weak maximum in 2025 with a ZHR of 60 to 70. The maximum was missed visually because it took place above the Pacific Ocean. According to radio and GMN observations the maximum occurred at λꙨ = 283.0°. This is 3.4 hours earlier than what was normally expected at λꙨ = 283.15° (Rendtel, 2025). A large subpeak with a ZHR of 50 observed at λꙨ = 283.3° (January 3, 2025 ~20h30m UT) matches nicely with the subpeak in the Global Meteor Network data.
1 Introduction
The new year always starts with an interesting meteor shower: the Quadrantids. This shower with medium-fast meteors is active between December 25 and January 15. It usually shows a short maximum around λꙨ = 283.15° (Rendtel, 2025). Sometimes the maximum is a bit earlier or later. The observed maximum ZHRs varied quite a bit, years with weak activity have a maximum ZHR of 60, but in good years the ZHR can rise to above 150. For example, in 1995 a ZHR of 110 was found based on DMS observations (Jenniskens et al., 1997). That year the maximum night also resulted in dozens of high-precision orbits of the Quadrantids. Among other things, with this, Peter Jenniskens succeeded in discovering the suspected parent body asteroid 2003 EH1 in a minor planet database of NASA J.P.L. This celestial body may also be the same as comet C/1490 Y1 that has been observed from China. So, it is not an asteroid but probably an extinct comet (Jenniskens, 2006).
The meteor shower also surprised meteor observers in 2009. On the freezing cold night of 2–3 January, European observers observed activity that was well above what was expected. At the end of the night, the ZHR was just around 100, while the maximum occurred around 10h UT (λꙨ = 283.039°) with a ZHR of over 140 (Johannink and Miskotte, 2009). This was 16 years ago, so in 2025 we were looking at approximately the same solar longitude.
In 2025, the conditions for observing the Quadrantids were favorable with a narrow crescent moon that set after 21 hours local time. The maximum was expected on 3 January around 15h UT (λꙨ = 283.15°) (Rendtel, 2025). This means for Europe slowly increasing Quadrantid frequencies during the night. America could then expect the highest activity, but the maximum would not be visible there either if it tooks place at λꙨ = 283.15°, this would be situated above the Pacific. The night of 3–4 January then gives rapidly decreasing ZHRs above Europe. And this also with a very low radiant position also playing a role during a large part of the night at the more northern locations. All this is not really favorable for an analysis of the peak activity, but we can perhaps say something about the maximum based on the increasing activity in combination with worldwide radio and GMN observations.
2 Data and method
First, the data was checked on the IMO website. There, 31 observers observed 936 Quadrantids in 55 sessions. That is not much when you consider that the meteor shower can reach a high ZHR. The distribution of the observers was traditional again: many observers active in Europe, a few in America and 9 from Asia. It is important to mention that 8 of the 9 Asian observers observed in Israel. As always, the data had to meet the following requirements:
• A reliable Cp must be known from the observer
• Minimum limiting magnitude 5.9
• A minimum radiant height of 25 degrees
• Maximum cloud cover correction k = 1.10
In addition to the night of 2–3 January, many observations were also made in the evening of 3 January in Europe. The radiant height was usually below the minimum 25-degree height limit. That is why the minimum radiant height for the maximum was set lower, to 10 degrees. The zenith attraction of the radiant has also been taken into account. Since Quadrantids have a geocentric velocity of 41 km/sec, this has only been done for radiant positions below 25 degrees, the differences above 25 degrees are rather small (Rendtel, 2022).
3 Population index r
From the observations, the population index r could be calculated according to Steyaert (1981). The results of these computations are shown in Table 1 and Figure 1. This gives a result that is recognizable for the Quadrantids. A somewhat higher population index r before the maximum and a somewhat lower population index r after the maximum. The low r value of January 3, 2025 around 0h30m UT is mainly caused by the lack of weak Quadrantids compared to the bright meteors.
Table 1 – Population index r[–1;5] Quadrantids 2025 based on 500 Quadrantids, all for the date 03 January 2025.
|
Time UT |
λꙨ (°) |
r[–1;5] |
QUA |
|
0.50 |
282.529 |
1.55 ± 0.45 |
30 |
|
1.50 |
282.572 |
2.44 ± 0.37 |
42 |
|
2.50 |
282.614 |
2.54 ± 0.31 |
55 |
|
3.50 |
282.657 |
2.89 ± 0.4 |
37 |
|
5.45 |
282.740 |
2.67 ± 0.2 |
114 |
|
9.08 |
282.894 |
2.70 ± 0.43 |
33 |
|
9.87 |
282.927 |
2.50 ± 0.43 |
33 |
|
11.03 |
282.977 |
2.54 ± 0.3 |
59 |
|
17.00 |
283.230 |
2.44 ± 0.43 |
34 |
|
17.50 |
283.252 |
2.29 ± 0.51 |
25 |
|
18.50 |
283.294 |
2.43 ± 0.39 |
38 |
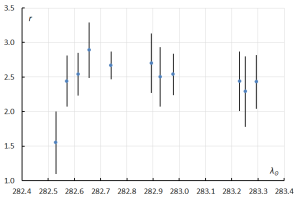
Figure 1 – Population index r [–1;5] Quadrantids 2025.
4 Zenithal Hourly Rate
After calculating the population index r, the minimum radiant height was first calculated at 25 degrees. This was then done again with a minimum radiant height of 10 degrees. The formula used to calculate the ZHR is:
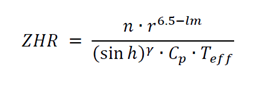
The gamma was set to 1 instead of 1.4 (Jenniskens, 1994). This resulted in Table 2 and Figures 2 and 3.
Table 2 – ZHR for the Quadrantids 2025 with radiant elevation above 10°. Tm = mean time, P is number of periods.
|
Day |
Tm UT |
λꙨ |
P |
QUA |
ZHR |
|
2 |
20.07 |
282.341 |
2 |
4 |
8.7 ± 4.4 |
|
2 |
20.78 |
282.371 |
2 |
4 |
8.3 ± 4.2 |
|
2 |
23.8 |
282.500 |
4 |
9 |
16.5 ± 5.5 |
|
3 |
0.10 |
282.513 |
9 |
27 |
19.1 ± 3.7 |
|
3 |
0.55 |
282.531 |
11 |
36 |
19.6 ± 3.3 |
|
3 |
1.11 |
282.555 |
17 |
56 |
18.4 ± 2.5 |
|
3 |
1.52 |
282.573 |
20 |
59 |
15.8 ± 2.1 |
|
3 |
1.97 |
282.592 |
22 |
87 |
17.5 ± 1.9 |
|
3 |
2.51 |
282.612 |
20 |
113 |
23.6 ± 2.2 |
|
3 |
2.94 |
282.633 |
16 |
98 |
25.6 ± 2.6 |
|
3 |
3.22 |
282.645 |
10 |
63 |
31.8 ± 4.0 |
|
3 |
4.75 |
282.710 |
5 |
47 |
35.3 ± 5.1 |
|
3 |
5.17 |
282.728 |
8 |
91 |
37.0 ± 3.9 |
|
3 |
5.54 |
282.744 |
7 |
83 |
36.0 ± 4.0 |
|
3 |
6.05 |
282.765 |
7 |
88 |
33.3 ± 3.5 |
|
3 |
6.41 |
282.781 |
5 |
47 |
29.8 ± 4.3 |
|
3 |
8.77 |
282.881 |
2 |
44 |
51.6 ± 7.8 |
|
3 |
9.63 |
282.917 |
3 |
67 |
49.9 ± 6.1 |
|
3 |
10.17 |
282.940 |
4 |
108 |
51.0 ± 4.9 |
|
3 |
10.47 |
282.953 |
4 |
116 |
53.6 ± 5.0 |
|
3 |
10.77 |
282.966 |
2 |
61 |
55.2 ± 7.1 |
|
3 |
17.18 |
283.238 |
10 |
64 |
30.5 ± 3.8 |
|
3 |
17.45 |
283.249 |
12 |
73 |
31.8 ± 3.7 |
|
3 |
18.08 |
283.276 |
9 |
35 |
29.8 ± 5.0 |
|
3 |
18.42 |
283.291 |
10 |
34 |
26.5 ± 4.5 |
|
3 |
18.91 |
283.311 |
9 |
29 |
24.1 ± 4.5 |
|
3 |
19.48 |
283.336 |
9 |
34 |
28.8 ± 4.9 |
|
3 |
19.92 |
283.354 |
8 |
36 |
34.8 ± 5.8 |
|
3 |
20.53 |
283.380 |
6 |
42 |
50.9 ± 7.9 |
|
3 |
23.50 |
283.506 |
5 |
7 |
13.8 ± 5.2 |
|
4 |
0.00 |
283.528 |
5 |
8 |
11.3 ± 4.0 |
|
4 |
0.58 |
283.533 |
7 |
22 |
19.4 ± 4.1 |
|
4 |
1.03 |
283.572 |
9 |
27 |
16.9 ± 3.3 |
|
4 |
1.58 |
283.595 |
11 |
27 |
11.8 ± 2.3 |
|
4 |
1.97 |
283.611 |
13 |
32 |
10.4 ± 1.8 |
|
4 |
2.56 |
283.636 |
15 |
54 |
14.6 ± 2.0 |
|
4 |
2.80 |
283.646 |
11 |
44 |
15.7 ± 2.4 |
|
4 |
3.03 |
283.657 |
4 |
15 |
14.7 ± 3.8 |
|
4 |
4.74 |
283.729 |
3 |
13 |
8.1 ± 2.2 |
|
4 |
5.83 |
283.775 |
2 |
15 |
8.7 ± 2.2 |
|
5 |
9.51 |
284.951 |
3 |
7 |
6.5 ± 2.5 |
|
7 |
4.26 |
286.766 |
2 |
10 |
10.0 ± 3.2 |
|
8 |
4.92 |
287.813 |
3 |
16 |
7.0 ± 1.8 |
|
9 |
5.17 |
288.843 |
3 |
10 |
4.1 ± 1.3 |
|
10 |
5.60 |
289.880 |
2 |
9 |
8.1 ± 2.7 |
|
11 |
6.44 |
290.934 |
2 |
5 |
3.9 ± 1.7 |
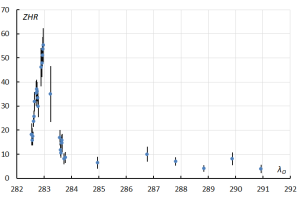
Figure 2 – ZHR of the Quadrantids between January 3 and 11, 2025. ZHR were calculated with radiant heights above 25°.
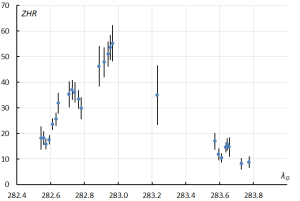
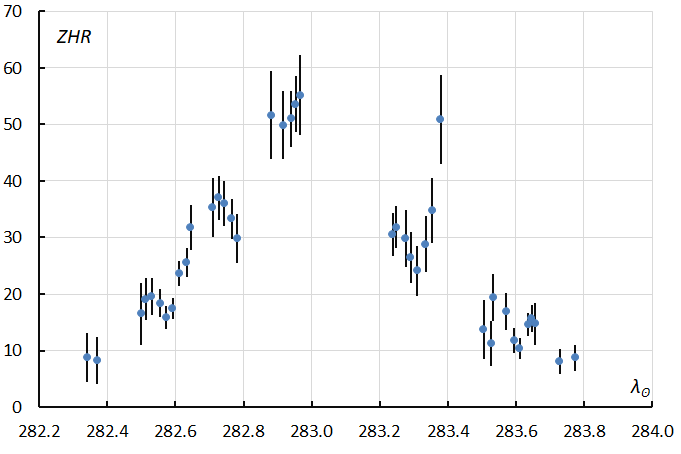
Figure 3 – ZHR of the Quadrantids between 3 January 2025, 0h UT and 4 January 2025, 6h UT. ZHRs were calculated with radiant heights higher than 25°.
Next, calculations were repeated with radiant heights from 10 degrees, whereby a correction was made for zenith attraction between 10 and 25 degrees of height. This resulted in Figure 4.
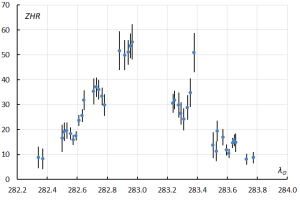
Figure 4 – ZHR of the Quadrantids between 3 January 2025, 0h UT and 4 January 2025, 6h UT. ZHR with radiant heights higher than 10 degrees.
It is noticeable in Figure 4 that the activity above Europe starts with low ZHRs of 16 and then to rise to a maximum ZHR of 37 during the night of Januari 2–3. Then the ZHR decreased to around 30 at the end of the night. When it got dark in North America, Terrence Ross and Pierre Martin, among others, saw a beautiful Quadrantid show. The ZHR rose from 50 to 60 during their observation period.
When it got dark again in Europe, the Quadrantid maximum was over and the ZHR was already dropping to around 30 and further decreasing. But then the ZHR rose again quite quickly to a ZHR of 50 around λꙨ = 283.3 (January 3, 2025 ~20h30m UT). A subpeak it seems, unfortunately Jürgen and Ina Rendtel, who observed this peak at the same location, had to stop due to cloud cover. Too bad that at that time there were no more observers active who could confirm this extra peak. All this with low radiant heights also causes somewhat larger deviations. When the Israeli observers started a few hours later (the Quadrantid radiant is not circumpolar in Israel and does not appear there until around 23h UT), the ZHR had already dropped back to ZHR values between 10 and 20.
5 Visual observations compared to global radio and GMN observations
In order to see if the visual subpeak is also visible in the radio observations, Hiroshi Ogawa & Hirofumi Sugimoto were asked for observational data from the radio observers. This data was put in the visual graph to see if the behavior is the same. Note that this data cannot be seen as 1 on 1, after all, these are two very different observation techniques. The result can be seen in Figure 5. Overall, the trend is the same. There is also a subpeak in the radio observations, but this occurred 3 hours earlier than the visually observed subpeak. So, no confirmation of the visual peak can be concluded from the radio observations.
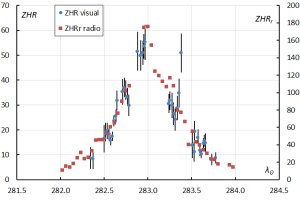
Figure 5 – The visual ZHR curve compared to the radio ZHRr curve. The radio ZHRr curve is scaled to the visual ZHR curve to see if the progression matches.
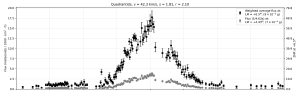
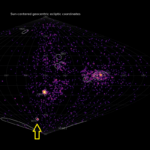
Figure 6 – The GMN flux and ZHR profile of the Quadrantids in 2025 (vida et al., 2021; 2022).
Next, the ZHR profile of the Quadrantids was checked up in the GMN database to compare with the radio and visual reasults. There is also a subpeak visible and appears at almost the same time as the visual subpeak. A compliment to the visual observers who observed this so beautifully, despite the low radiant position.
Both GMN and the radio ZHRr profile show the maximum exactly at λꙨ = 283.0°. This is 3.4 hours earlier than the expected maximum at λꙨ = 283.15°. Pierre Martin’s observation at λꙨ = 282.97° (January 3, 2025 at 10h55m UT) is the closest to the maximum found by GMN and radio observers at λꙨ = 283.0° (January 3, 2025 at 11h36m UT). His highest ZHR value was indeed in that last hour with a ZHR of 55 ± 7. GMN finds a ZHR of just below 60 at that same time and GMN’s maximum ZHR value with a ZHR of 70 some 40 minutes later matches nicely.
6 Conclusion
The Quadrantids showed a relatively weak maximum in 2025 with a ZHR of 60 to 70. The maximum was missed visually because it took place above the Pacific Ocean. According to radio and GMN observations the maximum occurred at λꙨ = 283.0°. This is 3.4 hours earlier than what was normally expected at λꙨ = 293.15° (Rendtel, 2025). A large subpeak with a ZHR of 50 observed at λꙨ = 283.3° (January 3, 2025 ~20h30m UT) matches nicely with the subpeak in the Global Meteor Network data.
Acknowledgments
A word of thanks to all the visual observers who observed the Quadrantids. These are: Mark Adams, Orlando Benítez Sánchez, Felix Bettonvil, Ido Braun, Steve Brown, Tal Dagan, Kai Gaarder, Christoph Gerber, Noa Ginzberg, Javor Kac, Omri Katz, Ralf Koschack, Anna Levin, Andreas Livbom, Pierre Martin, Koen Miskotte, Mohammad Nilforoushan, Ella Ratz, Ina Rendtel, Jürgen Rendtel, Fillip Romanov, Terrence Ross, Ulrich Sperberg, Tamara Tschenak, David Teissier, Snežana Todorović, Michel Vandeputte, Ariel Westfried, Roland Winkler, Frank Wächter and Sabine Wächter.
Furthermore, a word of thanks to Carl Johannink and Michel Vandeputte for reviewing this article. Also, a thank you for Paul Roggemans for checking my English. Thanks also to Hirofumi Sugimoto and Hiroshi Ogawa for providing the radio observations. Finally, a word of thanks to the Global Meteor Network volunteers and the network administrators .
